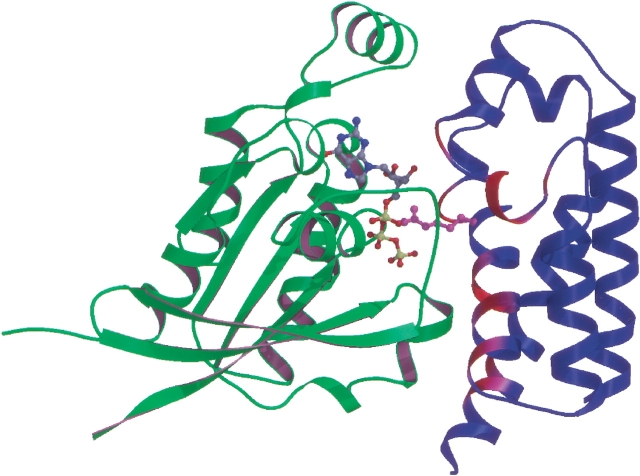
Fig. 4.
Model of the YopEGAP-Rac1 complex. YopEGAP and Rac1 are shown in blue and green, respectively. The bound GTP molecule is represented by a ball-and-stick model, colored according to atom type (C, gray; N, blue; O, red; and P, yellow). The critical arginine in YopEGAP is in magenta. Other parts of the YopEGAP structure that are likely to contact Rac1 are depicted in a gradient from magenta to red, with red being most probable.

