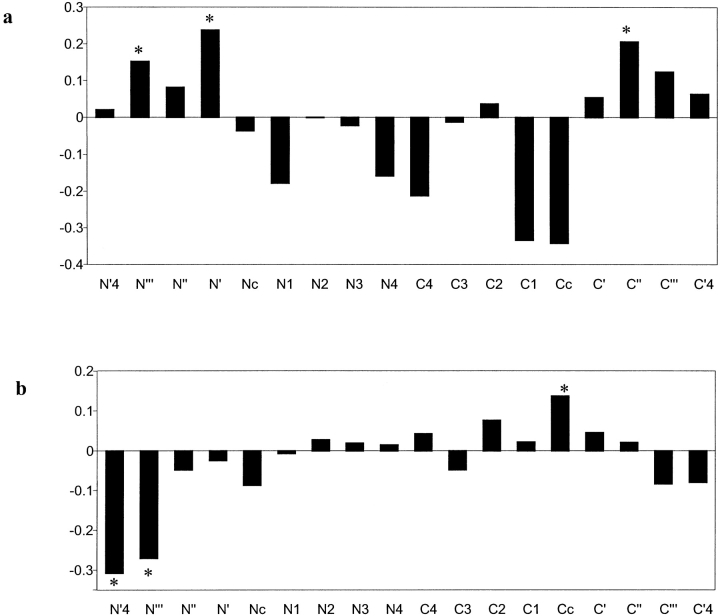
Fig. 5.
Frequency of mutually persistently conserved (MPC) positions in secondary structure elements. The X-axis shows the positions in and flanking the secondary structure element (nomenclature after Aurora and Rose 1998). The flanking regions are marked with apostrophes, the in-element residues with digits, and the initial and terminal (capping) residues with a "c." The Y-axis is the logarithm of the ratio between the actual frequency of MPC residues in a position and that expected at random, based on the overall frequency of MPC positions in the data. The positions in which MPCs were found to be significantly over- or under-represented are marked with an "*." (a) α helices; (b) β strands.

