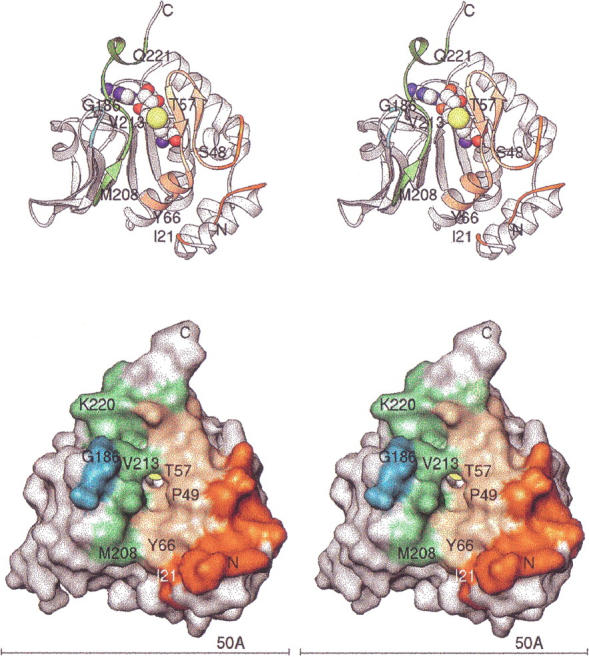
Fig. 2.

Architecture of HPIMT. (Top) Stereo ribbon diagram with key residues labeled. Residues forming the surface cleft for putative substrate interaction are colored. Yellow-orange and dark orange designate N-terminal residues; cyan and green designate residues of the C-terminal region. The AdoHcy is colored by atom type with sulfur yellow. (Bottom) Stereo view of the molecular surface (Connolly 1993) in the same orientation. The surface residues are colored as in the ribbon drawing. All molecular figures were prepared with Ribbons (Carson 1997; http://sgce.cbse.uab.edu/ribbons).
