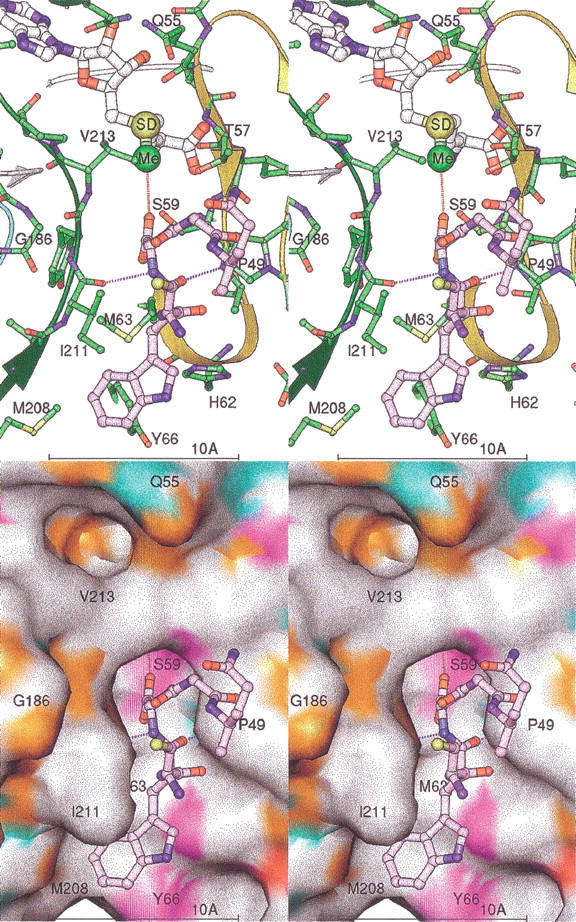
Fig. 6.

Stereo views of the isoAsp peptide-binding model. The isoAsp-containing peptide is shown in lavender. Only five residues are shown for clarity. The protein ribbon is colored as in Fig. 2 ▶. Key residues of the protein are labeled. Dashed lines mark the hydrogen bonding of the protein to the peptide (lengths ∼2.9 Å). The AdoMet model is shown with the SD and activated methyl group (Me) as larger spheres. A dashed line marks the path of methyl transfer, with a distance of ∼3.1 Å. The surface is colored by chemical property as in Fig. 5b ▶.
