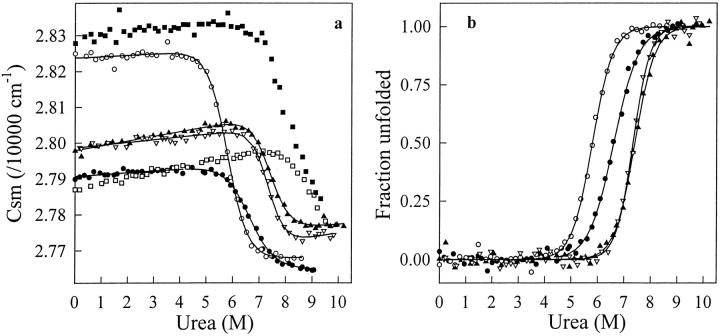
Fig. 5.
(a) Urea-induced unfolding transition of cAb-HuL6 (open squares), cAb-Lys3 (filled circles), cAb-NmcA2 (filled squares), cAb-BcII10 (filled triangles), cAb-TEM2 (open triangles), and cAb-R2 (open circles) at pH 7.0, 25°C, monitored by the change in the center of the spectral mass (csm) of the fluorescence spectra recorded between 310 and 440 nm. Protein concentrations were 25 μg mL−1 in 50 mM phosphate sodium. Excitation wavelengths were 280 nm (all fragments but cAb-Lys3) and 295 nm (cAb-Lys3). Data were analyzed according to a two-state reaction, and the lines represent the best fits to Equation 2, calculated using the thermodynamic parameters in Table 2; (b) Fraction of VHH unfolded, fU, as a function of urea concentration. The values of fU were calculated from the data in (a), as described in Pace (1986, 1990a).

