
Fig. 8.
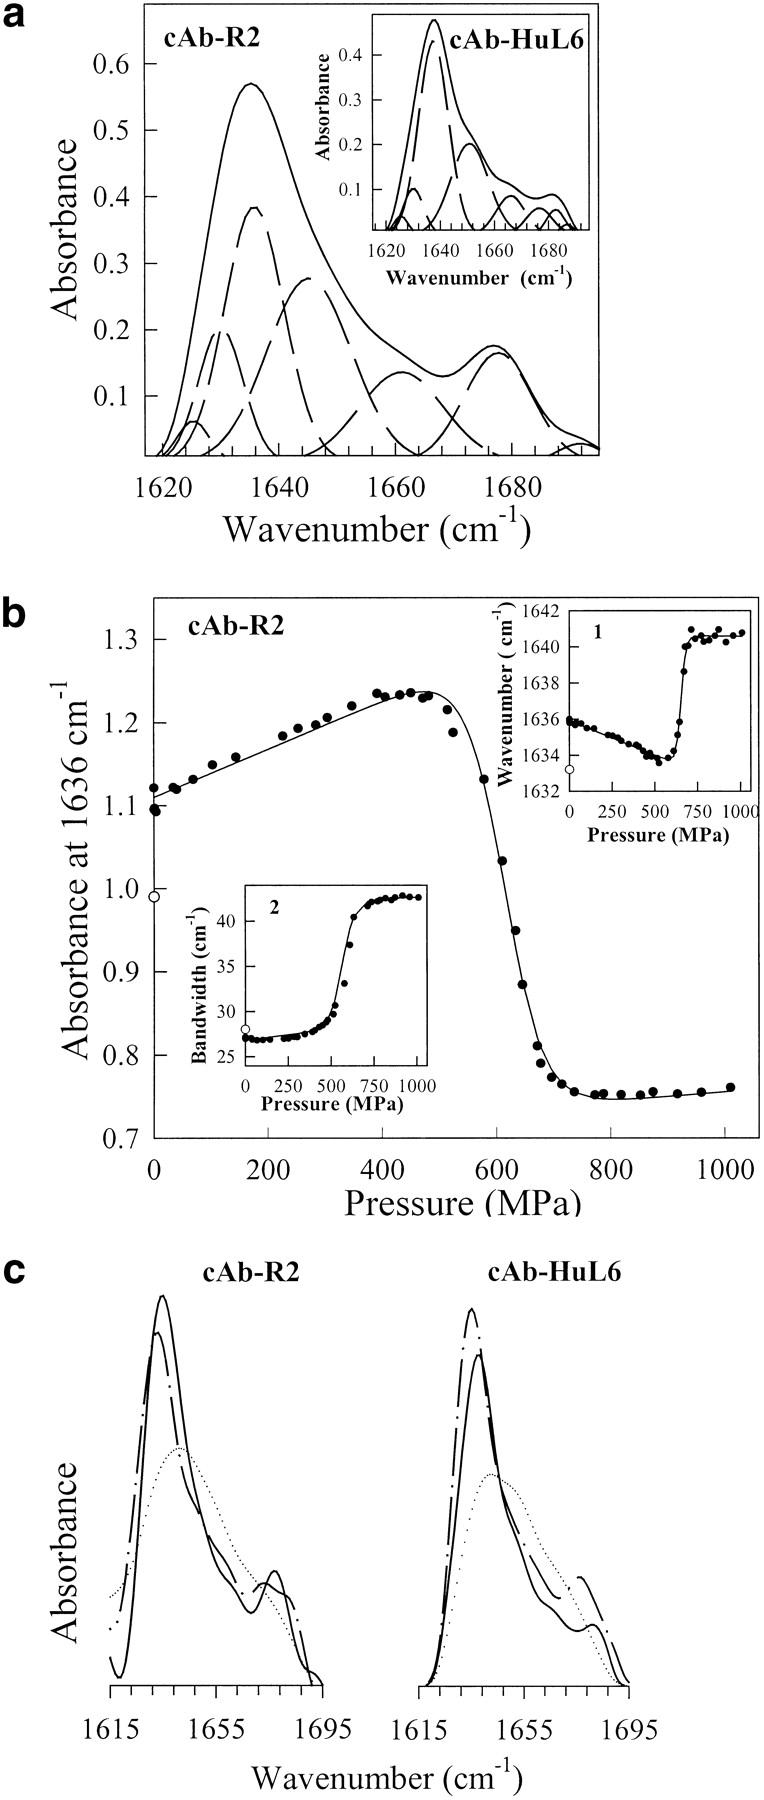
(a) Fourier-deconvoluted and fitted infrared spectra in the amide I` region (solid lines) with individual Gaussian components (broken lines) of cAb-R2 and cAb-HuL6 (inset). IR spectra were recorded at atmospheric pressure (0.1 MPa) and 25°C, using protein concentrations of about 50 mg mL−1 (∼3.6 mM) in 1 M 13C-urea and 10 mM TrisDCl, pD 7.6; (b) Pressure-induced unfolding curves of cAb-R2 followed by IR measurements. The absorbance at 1636 cm−1, the wavenumber corresponding to the maximum in absorbance (inset 1), and the amide I` bandwidth (inset 2) were used to monitor VHH unfolding. The solid lines represent the best fits of the data to Equation 3, as calculated from the parameters in Table 4. In each case, the value of the refolded state is indicated (open circles); (c) FTIR spectra of cAb-R2 and cAb-HuL6 under native (0.1 MPa; continuous line), unfolding (1060 MPa, dotted line) and refolding (0.1 MPa; broken line) conditions.