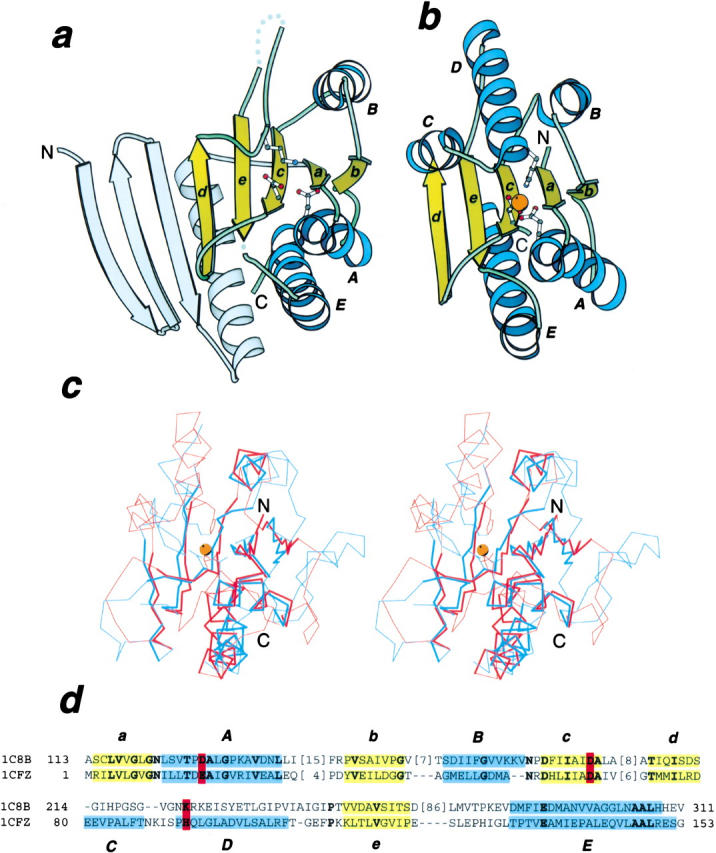
Fig. 1.

Ribbon diagram and structure superposition of GPR and HybD. (a) Ribbon diagram of B. megaterium GPR, PDB entry 1c8b, chain A, residues 143 to 460. (b) Ribbon diagram of E. coli hydrogenase maturation protease HybD, pdb entry 1cfz, chain A, residues 2 to 154. Secondary structure elements forming the phosphorylase/hydrolase fold are labeled. Side-chains of the metal binding residues in HybD and their structural counterparts in GPR are shown in ball-and-stick representation. The metal ion in HybD is shown as an orange ball. (c) Stereo pair of superimposed Cα traces of GPR (blue) and HybD (red). The side-chain of the (putative) metal ligands and the metal are also shown. Unconserved regions not used in RMSD minimization are shown as thin lines. (d) Structure-based sequence alignment of GPR and HybD. Coloring and labeling are as in (a) and (b). The (putative) metal ligands are in bold letters and are shaded in red. Positions with identical residues are in bold letters. All structure diagrams are drawn with Bobscript (Esnouf 1997).
