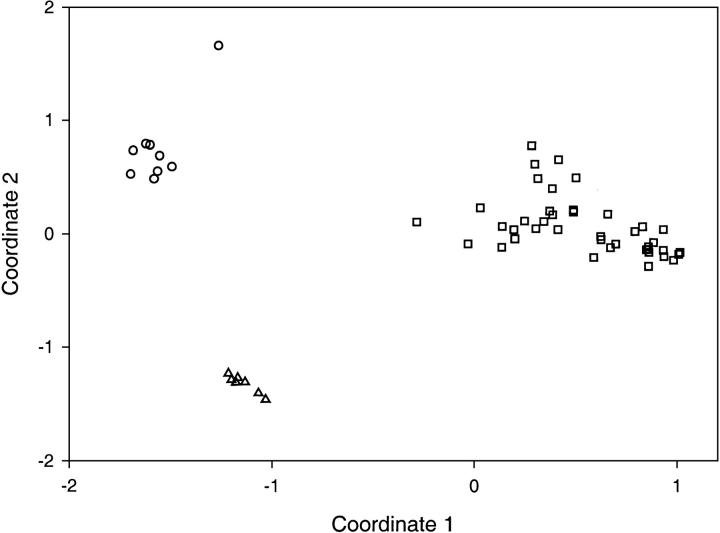
Fig. 3.
Distance diagram of GPRs (triangles), hydrogenase maturation proteases (rectangles), and the intermediate sequences (circles). Coordinates 1 and 2 are the dimensions of maximal scatter of points in a multidimensional Euclidean space. The points represent all the sequences in Figure 2 ▶.

