
Fig. 3.
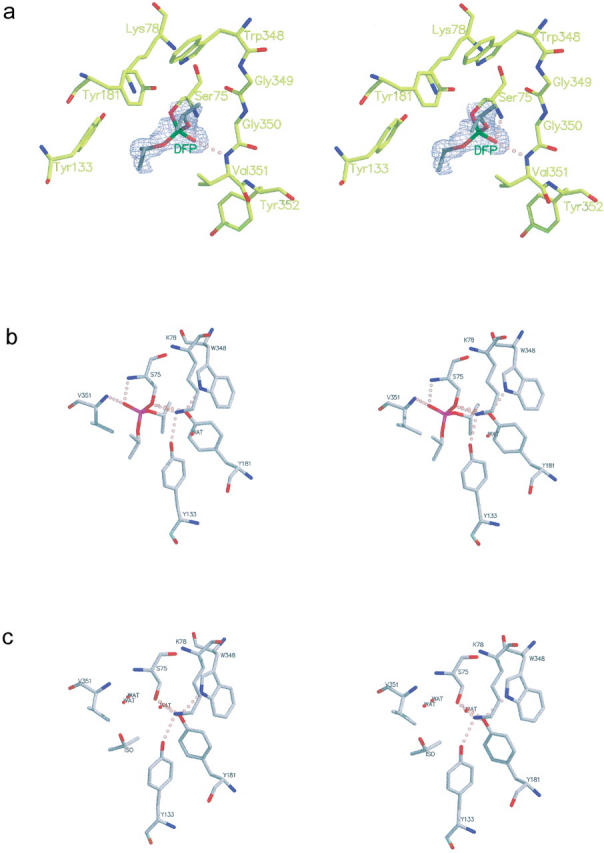
Difference density map (Fo–Fc, 3σ contours) of the active site of the EstB–DFP complex (a) and stereoscopic representations of the active-site residues of EstB with (b) and without (c) the covalently attached DPF inhibitor. Note that the feature labeled "ISO" represents a molecule of isopropanol observed near the active site of the native structure.