
Fig. 1.
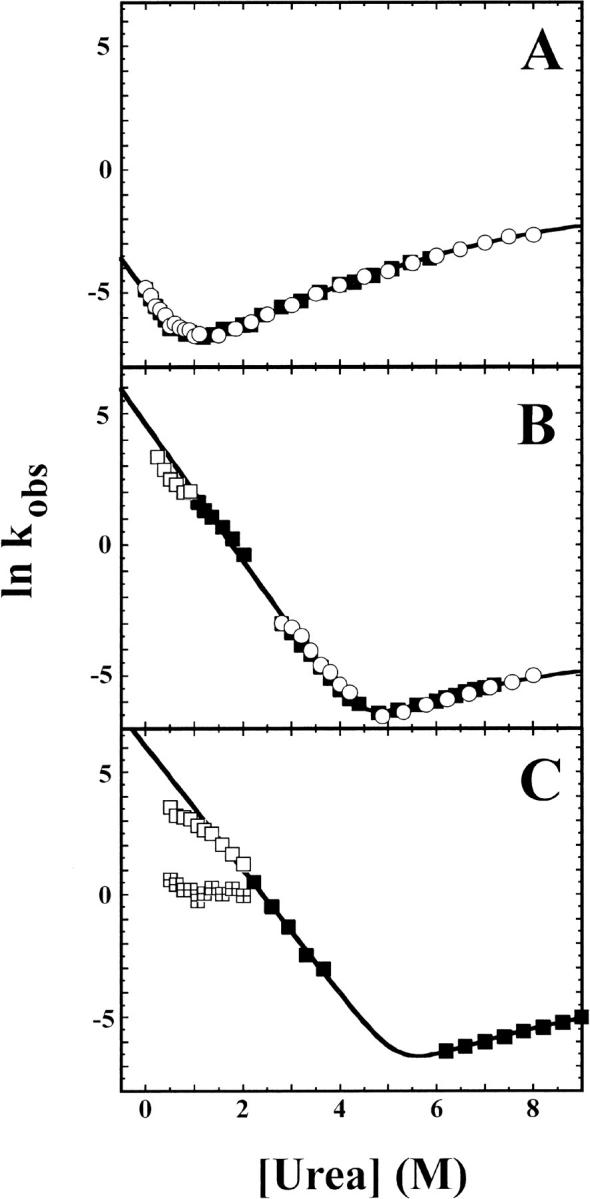
Natural logarithm of observed unfolding and refolding rate constants of hisactophilin. Rates measured by CD (open circles) and fluorescence (solid squares, open squares, and quartered squares) as a function of urea concentration for (A) pH 5.7 in H2O, (B) pH 7.7 in H2O, and (C) pH 7.8 in D2O. In all three cases the amplitudes of the kinetic traces correspond to the expected amplitudes based on equilibrium denaturation curves under identical conditions. Kinetics traces were well fit by a single-exponential function except for data below 2.0 M urea at pH 7.8 in D2O, which required fitting by a double-exponential function (open squares and quartered squares represent rates for the fast and slow phase, respectively, in panel C). For the double-exponential fits, the fast phase accounts for >90% of the fluorescence signal changes. The kinetic rate constants were fit by nonlinear least-squares regression to equation 3. The value of munf,2 was fixed to 0.0473, which is the average value for curvature of unfolding rates obtained from repeated experiments at pH 5.7. All kinetic data were included for fits at pH 5.7, but at higher pH only the rates under conditions where intermediate formation is insignificant are included (solid squares). Solid lines represent fits for CD data at pH 5.7 (open circles) and fluorescence data at pH 7.7 and 7.8 (solid squares). Values obtained for fitted parameters are summarized in Table 1.