Figure 2.
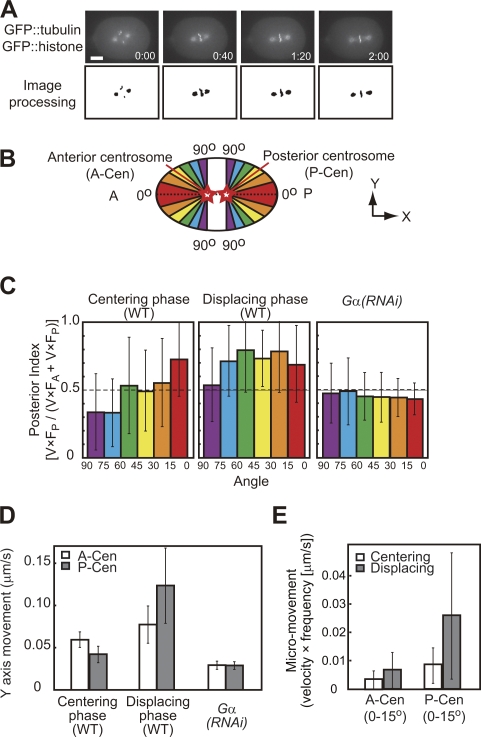
Comparison of micromovements during the centering and displacing phase. (A) Image processing to detect centrosomes and chromosomes (bottom) in images of GFP-tubulin and -histone embryos (top). Time is shown in minutes and seconds. (B) Micromovements were classified according to their angles to the AP axis (θ). (C) Posterior indexes (see Results and discussion) for each angle class. n = 13 for WT and n = 15 for Gα(RNAi). (D) Lateral components of the micromovements (V × sinθ). (E) Micromovements of the anterior centrosome (V × F A) and the posterior centrosome (V × F P) toward the polar regions (0–15°). Error bars represent SD. Bar, 10 μm.

