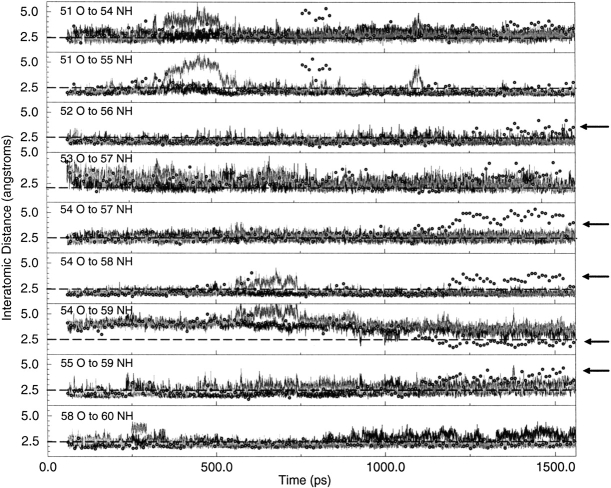
Fig. 3.
Interatomic distances for atoms involved in hinge helix hydrogen bonds as a function of simulation time. Distances are plotted for the entire 1600 ps simulation; black lines indicate those for one monomer, and gray lines represent the second. Generally, distances are the same for the two monomers and the gray lines obscure the black lines. Small open circles are used to plot the same data from the simulation of NlacP monomer. Arrows at the right of various graphs denote differences in monomer and dimer behavior. The dashed lines at 2.5 Å represent the length of an average hydrogen bond.

