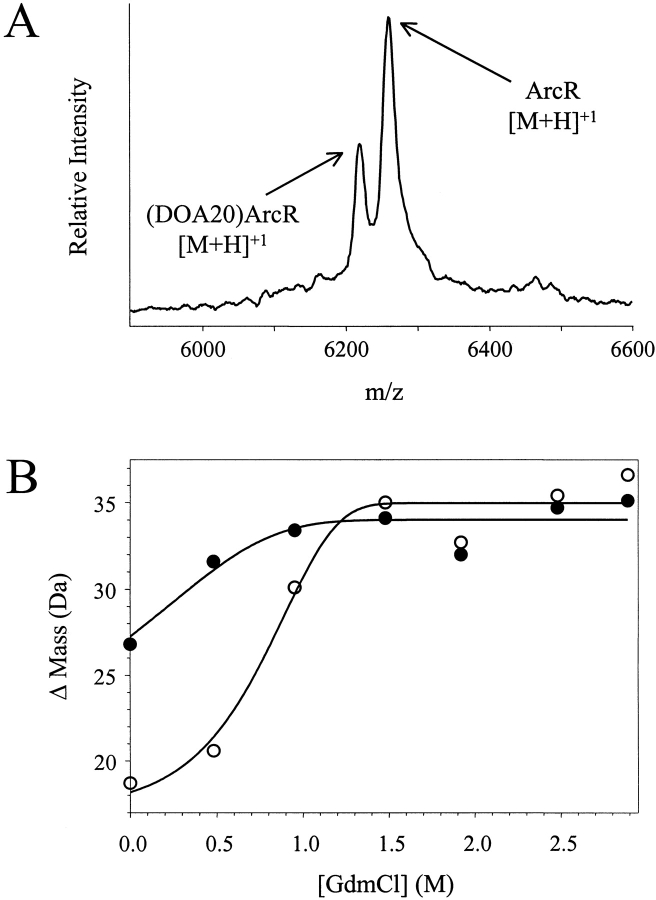
Fig. 3.
Results from the SUPREX analysis of a binary mixture of ArcR and (DOA20)ArcR. (A) Representative MALDI mass spectrum acquired in the SUPREX analysis of the binary mixture. (B) Typical SUPREX data obtained for ArcR (open circles) and (DOA20)ArcR (closed circles) when a binary mixture of the two proteins was analyzed. The concentration of each protein was 24 μM. The lines represent the best fit of the data to equation (7).

