Fig. 4.
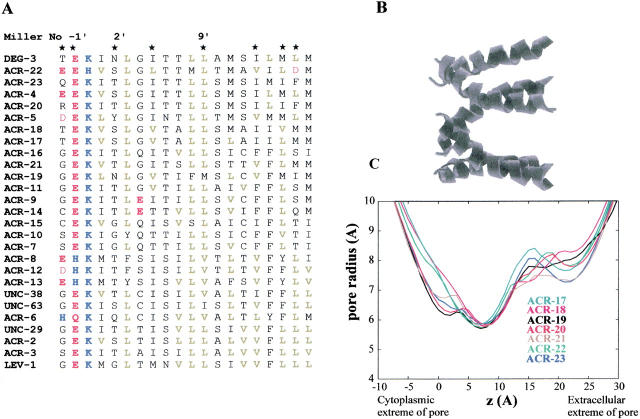
(A) An alignment of the predicted amino acid sequences of all C. elegans nAChR subunits was calculated using ClustalW. Only the sequence of M2, the second transmembrane region, is illustrated. Amino acid residues are numbered according to Miller (1989) and are colored according to side chain properties: acidic (red), basic (blue), and aliphatic (green). (B) Molecular models of M2 homo-pentameric α-helix bundles were generated by simulated annealing/molecular dynamics using restraints derived from structural and mutagenesis data (Sankararamakrishnan et al. 1996; Adcock et al. 1998). The upper diagram shows an M2 helix bundle, with the peptide backbone shown as helical ribbons. The N-termini of the helices (corresponding to the intracellular mouth of the pore) are shown on the left-hand side of the diagram. (C) Pore radius profiles determined for the M2 α-helix bundle models. The HOLE algorithm (Smart et al. 1996) was used to determine pore radius profiles.

