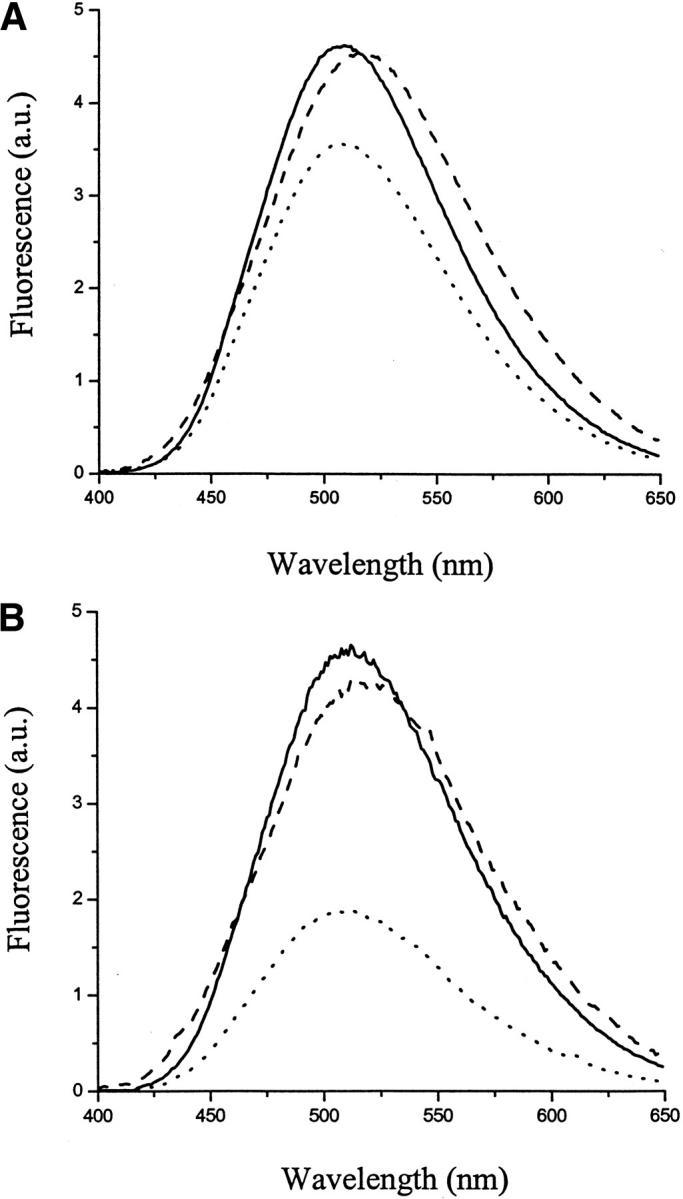
Fig. 4.

Fluorescence resonance energy transfer study on soluble-state and α-helical-state dansyl-SC3. (A) Solid line: fluorescence spectrum of soluble-state TFA/dansyl-SC3 in buffer. Dotted line: TFA/dansyl-SC3+TFA/dabcyl-SC3 in buffer (molar ratio 1:1). Dashed line: the same sample as dotted line but supplemented with Teflon spheres. (B) Solid line: fluorescence spectrum of soluble TFA/dansyl-SC3 in buffer. Dotted line: TFA/dansyl-SC3/dabcyl-SC3 in buffer (molar ratio 1:1). Dashed line: the same sample as dotted line but supplemented with Teflon spheres. The spectra were corrected for the background signal and the volume changes.
