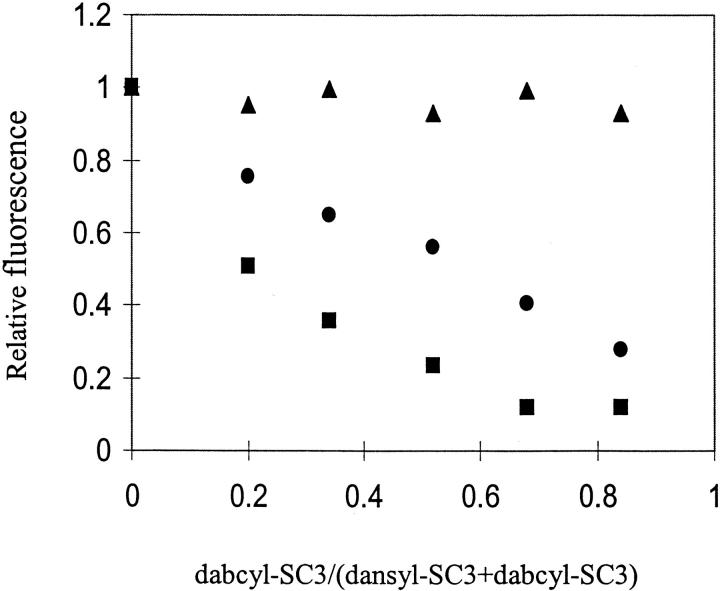
Fig. 5.
Concentration-dependent FRET on soluble-state and α-helical-state dansyl-SC3. Black dots: relative fluorescence intensities of TFA/dansyl-SC3 in the presence of different amounts of TFA/dabcyl-SC3. Black squares: normalized fluorescence intensities of the same samples as black dots but with freeze-drying, TFA treatment, and being dissolved in buffer. Black triangles: normalized fluorescence intensities of the same samples as black squares but supplemented with Teflon spheres.

