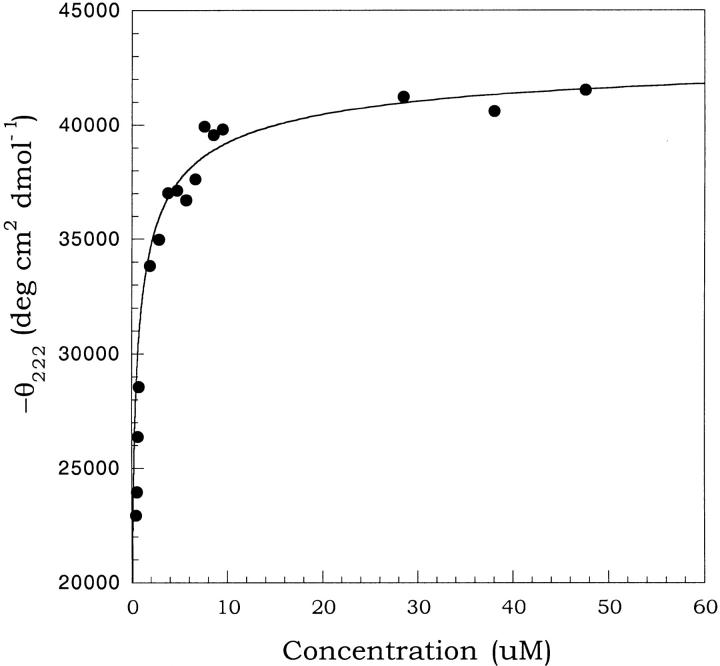
Fig. 5.
Concentration dependence of the ellipticity for the b53–122 protein. The plot shows the mean residue ellipticity at 222 nm (θ222) vs the protein concentration. The concentrations ranged from 0.5–50 μM in 25 mM Na2HPO4, pH 7.5 and 5°C. The curve shown is the best fit line according to equation 2 for a folded dimer (F2) to folded monomer (F) equilibrium yielding a Kd = 0.6 ± 0.2 μM.

