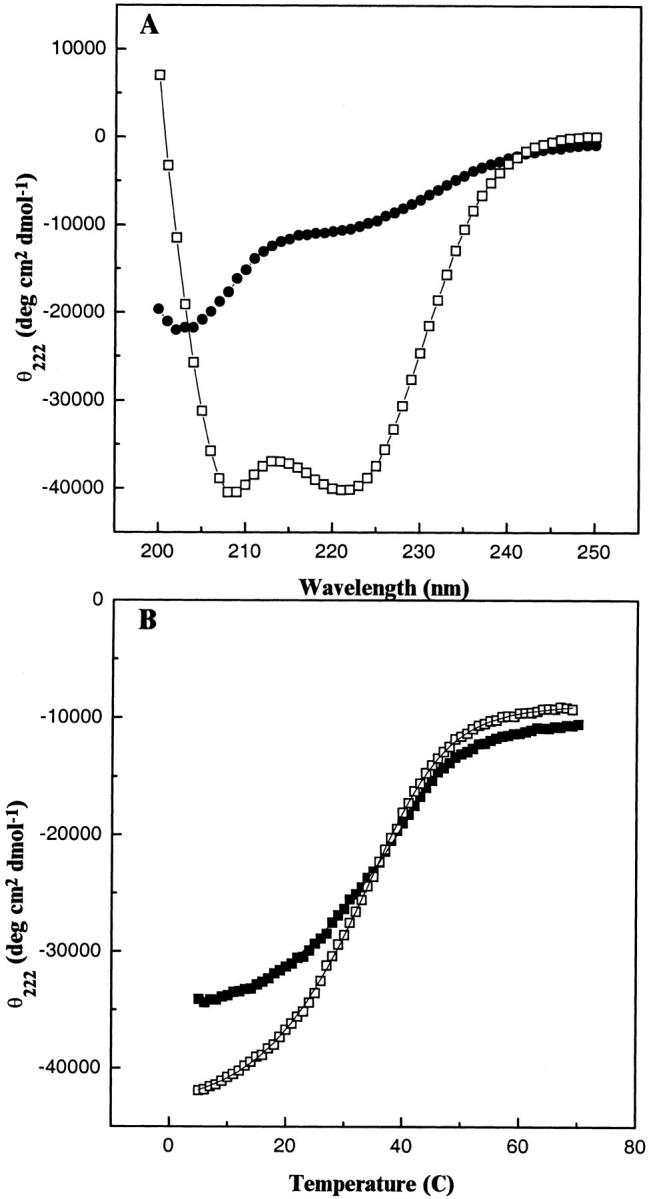
Fig. 6.

CD analysis of the temperature-dependent denaturation of b53–122. (A) Spectra of the folded dimeric and unfolded monomeric forms of b53–122. The spectra show 100 μM b53–122 at 5°C (□) and after thermal unfolding at 70°C (•). (B) Thermal unfolding profiles of b subunit proteins monitored by CD spectroscopy. The mean residue ellipticity at 222 nm (θ222) for b53–122 (□) and b24–156 (▪) were monitored as a function of temperature. The θ222 values were acquired at 1°C intervals using a 1-min equilibrium time at each temperature. The curves drawn through the data indicate the best fit lines for the thermal unfolding based on equation 3.
