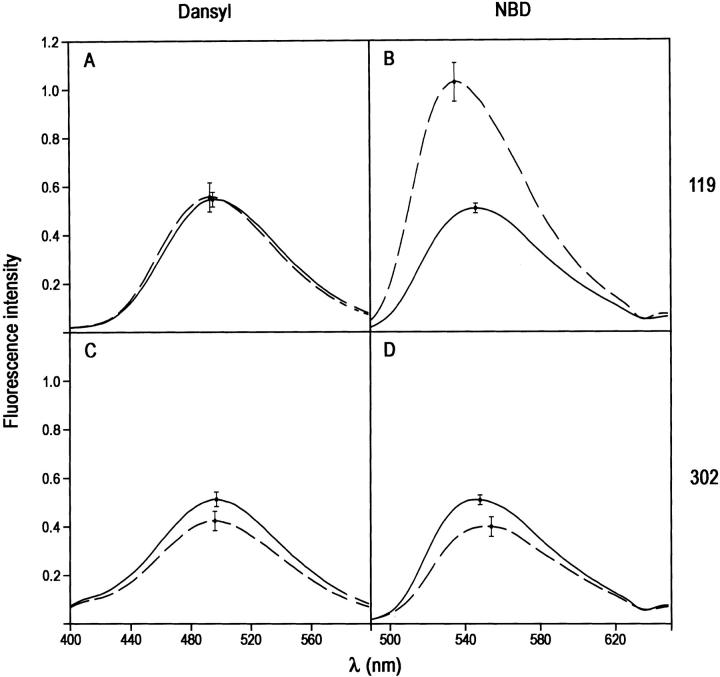
Fig. 2.
Effect of reactive center-loop cleavage and insertion on the fluorescence emission spectra of PAI-1 species labeled at either position 119 or 302 with the fluorophore IAEDANS or NBD. Each panel shows spectra from native (solid line) and cleaved (dashed line) species. (A) 119C-dansyl-PAI-1; (B) 119C-NBD-PAI-1; (C) 302C-dansyl-PAI-1; (D) 302-NBD-PAI-1. Spectra have been normalized to the same label concentration. Error bars at the wavelength maximum show the range of variation in intensity seen in separate experiments.

