Fig. 2.
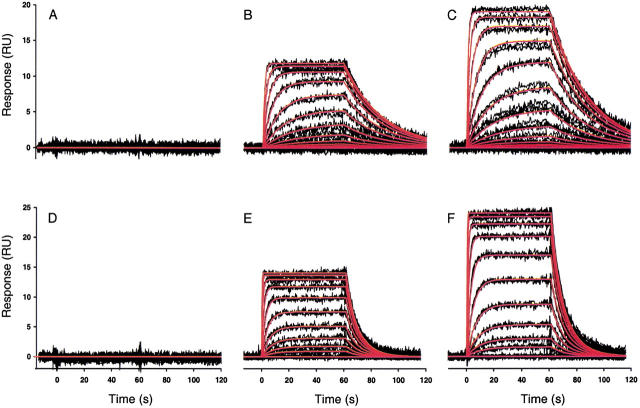
High-resolution kinetic analysis of the binding of CBS and DNSA to CA II surfaces using a Biacore 2000 biosensor. Black lines show biosensor data collected at 25°C for triplicate injections of CBS (12 nM to 25 μM) (A–C) and DNSA (20 nM to 10 μM) (D–F), across a nonderivatized surface (A and D) and two surfaces derivatized with different densities of CA II, 2400 RU (B and E) and 4600 RU (C and F). Sulfonamide concentrations were prepared by twofold serial dilutions in PBS buffer at pH 7.4. Red lines indicate the global fits obtained for both systems. CBS binding data were fit to a 1:1 interaction model, A + B = AB, whereas DNSA binding data were fit to a mass transport model, A0 = A, A + B = AB, due to its faster association rate.

