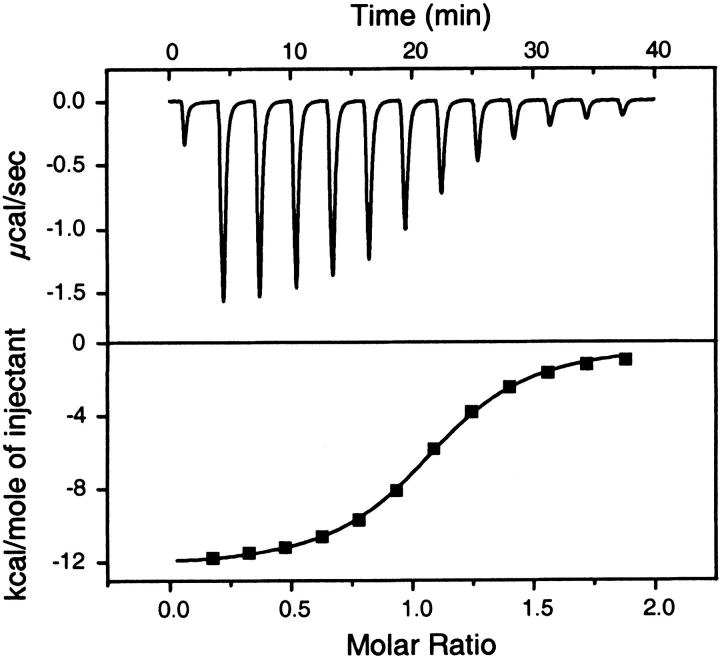
Fig. 3.
ITC data for the CA II/CBS interaction. The upper panel shows the rate of heat released as a function of time from 10-μL injections of 400 μM CBS titrated into a cell containing 20 μM CA II, measured at 25°C. The lower panel shows the integrated areas under the respective peaks in the top panel plotted against the molar ratio of CBS titrated into CA II. The calculated best-fit binding isotherm is shown in the lower panel.

