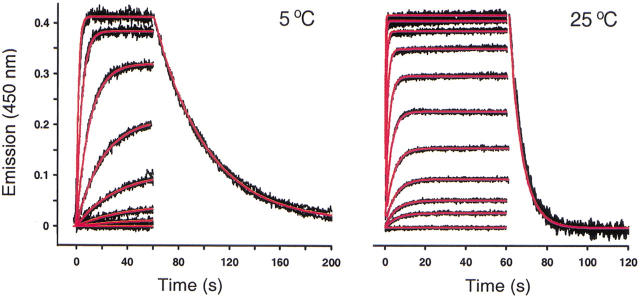
Fig. 6.
Kinetic analysis of the CA II/DNSA interaction as measured by SFF. The black lines represent four independent fluorescence traces generated for the interaction between CA II and DNSA at 5 and 25°C. In the association study, the final concentrations achieved by rapidly mixing the reactants were 5 nM CA II and (5°C) 60 nM to 5 μM DNSA and (25°C) 39 nM to 20 μM DNSA. A dissociation curve for the highest DNSA concentration was determined in a separate experiment, and is shown for each data set. Global fits to a single-site interaction model are shown in red.

