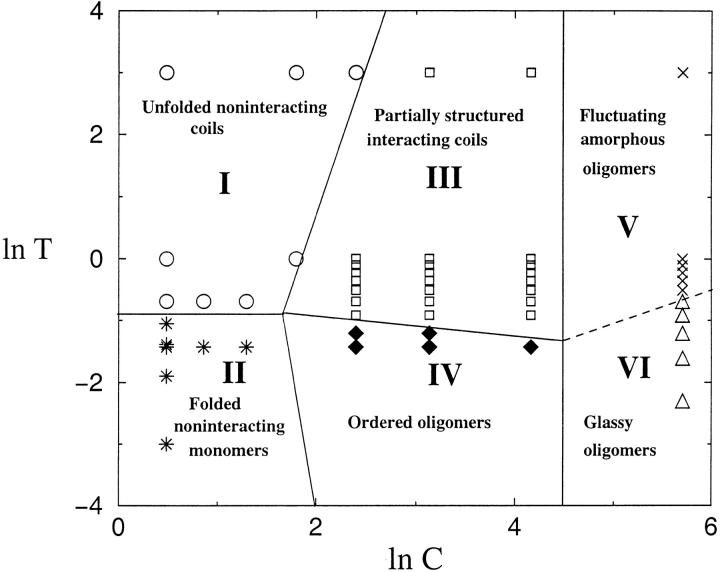
Fig. 7.
Phase diagram in the (T,C) plane for a generic two-state folder. A rich set of phases, including ordered oligomers and amorphous structures, is predicted. The solid lines separating the phases are drawn to guide the eye. The symbols indicate the structures obtained by energy minimization for a dimer (whose monomeric sequence is given in Fig. 6 ▶) (see Materials and Methods for details). The dashed line, separating regions V and VI, is meant to indicate that there are distinct amorphous structures. These can be distinguished by morphology as well as kinetics. There are substructures in the ordered region (see text). The boundaries between them (OD, PD, DS) are difficult to compute numerically.

