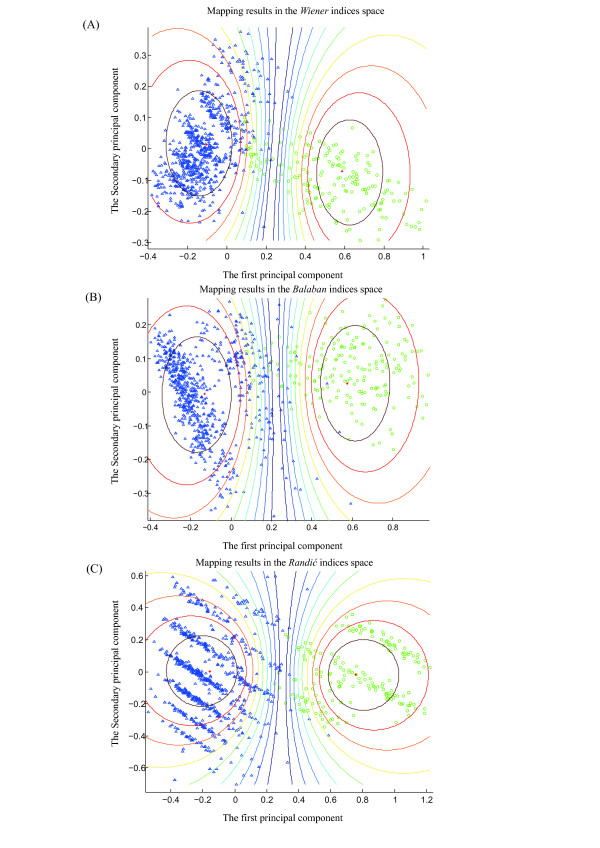
Figure 3.
Mapping results of miRNA identification. The mapping results of miRNA identification using K-means clustering algorithm for the three topological index families are shown. In this application case study, 200 real pre-miRNAs are randomly chosen from the 1,082 miRNAs in dataset of Table 1, and the corresponding 1,000 pseudo pre-miRNAs are generated as reference set. Principal component analysis mapping method is employed here to visualize the clustering results for three types of topological indices. The green circle and blue upward-pointing triangle respectively represent real and pseudo pre-miRNAs, and the centroid is marked with red '+'. (A) Mapping result of the real and pseudo pre-miRNAs in the Wiener indices space. (B) Mapping result of real and pseudo pre-miRNAs in the Balaban indices space. (C) Mapping result of real and pseudo pre-miRNAs in the Randić indices space.

