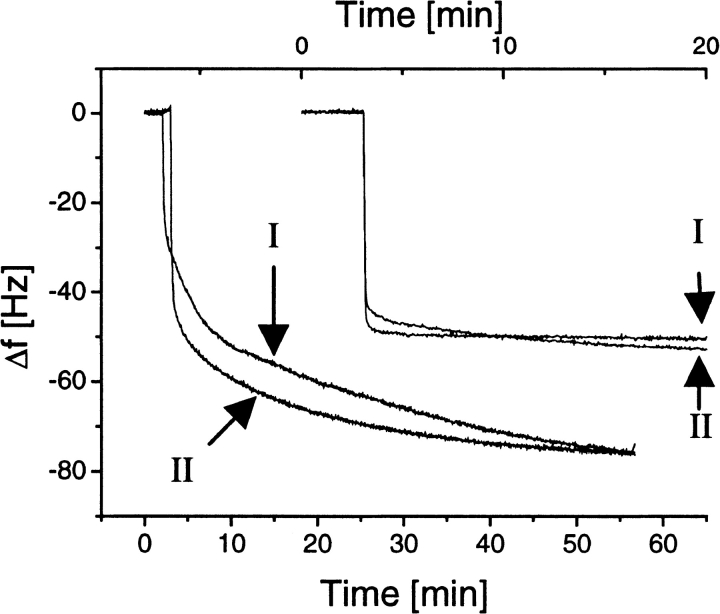
Fig. 4.
Quartz crystal microbalance measurement of free hydrophobin binding to silanized and untreated quartz surface. The two curves at the upper right show binding of HFBI (I) and HFBII (II) to the silanized surface, and the two curves at the lower left show binding of the same proteins to the untreated surface. The frequency shifts are shown on the same x-axis, but the time scale has been shifted for clarity, so that the upper x-axis shows the time for binding to the silanized surface and the lower x-axis shows the binding to the untreated surface.

