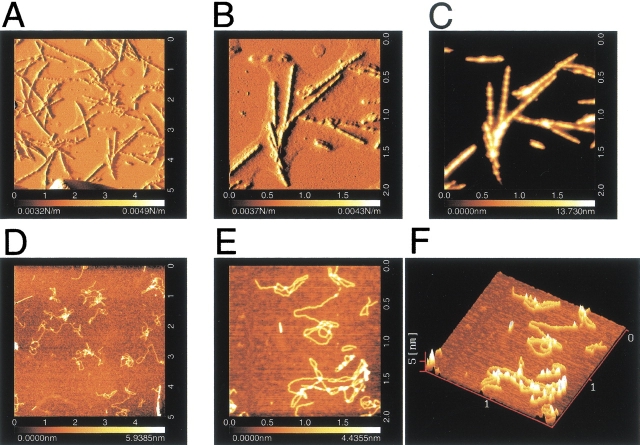
Fig. 2.
AFM images of amyloid fibrils and filaments of β2-m. (A–C) Intact β2-m fibrils; (D–F) reduced β2-m filaments. (A,B) Amplitude images; (C–E) topographic images; (F) a 3D image. The full scales of (A) and (D) are 5 μm and those of (B), (C), (E), and (F) are 2 μm. The scale on the bottom represents the height of pixels in the image; the lighter the color the higher the feature is from the surface.

