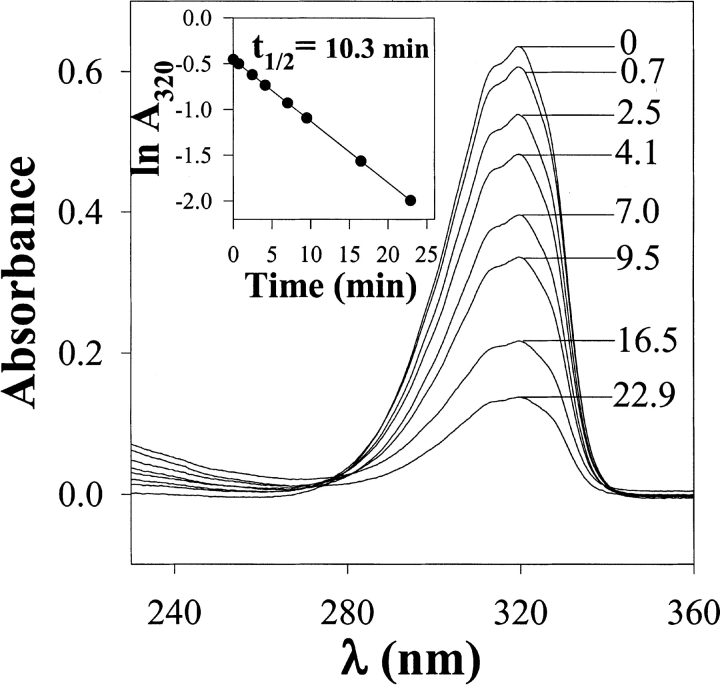
Fig. 1.
Photolysis of DZN in aqueous solution (ultraviolet [UV] spectra). The sample (3.5 mM DZN) was irradiated for the times in minutes shown in each spectrum with light from a filtered UV source (λ>300 nm), as described in Materials and Methods. The inset shows the decay of the absorbance at 320 nm as a function of time of photolysis in a semilogarithmic representation.

