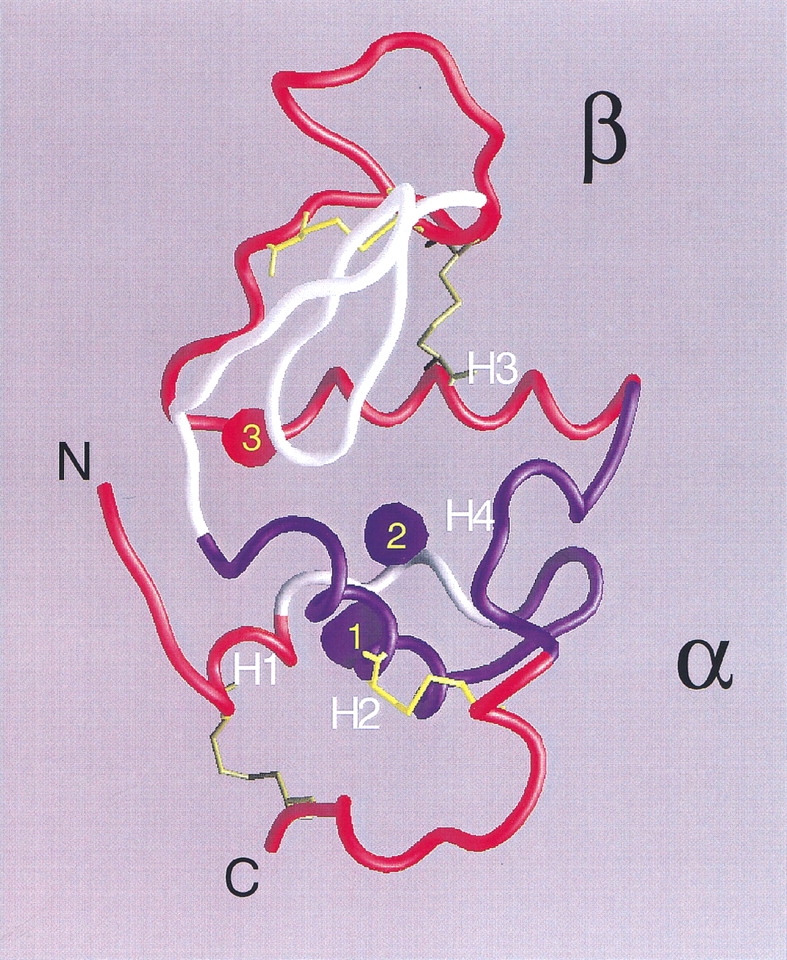
Fig. 8.

Structure of native α-LA (from pdb 1f6s; Chrysina et al. 2000). Helices H1 (5–11), H2 (23–34), H3 (86–98), and the loop/helix H4 (105–110) are indicated. Peptides (Table 1) having 3H-methylene labeling increments upon unfolding well correlated with theoretical ASA increments are colored in red (B1 and F from the β subdomain; B2 and D3 at the interface between subdomains; D1 and D4 from the N-terminal end, and C and D2 from the C-terminal end, both ends belonging to the α subdomain), whereas those having anomalously low labeling increments are shown in blue (A2 and E from the α subdomain). Peptides not found after tryptic digestion are shown in white. Empty cavities are indicated as blue blobs, whereas in red is that occupied by calcium and water. Cavity 1 (22 Å3) is delimited by residues F9, L12, L23, W26, and V27; cavity 2 (16 Å3) by W26, T29, T30, T33, F53, and W104; and cavity 3 by L52, F80, D82, L85, and D88. Cavity volumes and boundaries were calculated with MSP (Connolly 1993) using a probe radius of 1.4 Å. The final figure was rendered with GRASP (Nicholls et al. 1991).
