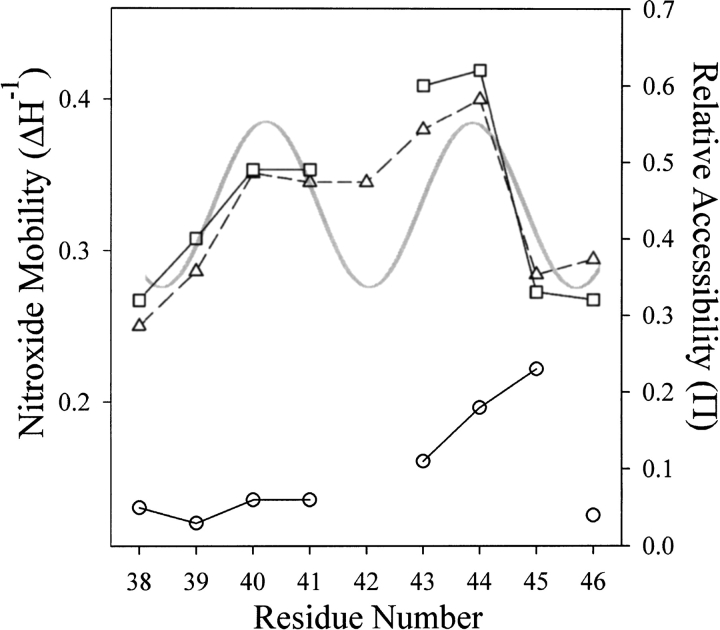
Fig. 4.
Mobility and accessibility of the R1 spin label along a nine-residue sequence of TM1. The mobility parameter ΔH−1 (▵) and the accessibility parameters |gP(O2) (□) and |gP(NiEDDA) (○) are plotted for positions 38–46 of chemoreceptor Trg. The gray, continuous curve is a plot of the helical periodicity of TM1 derived from cysteine-scanning (Lee et al. 1995a) and patterns of disulfide cross-linking between introduced cysteines (Lee et al. 1994; Hughson et al. 1997), with minima corresponding to the face of TM1 closest to its nearest neighbors TM1` and TM2 and maxima corresponding to the solvent-exposed face (see Fig. 1B ▶).

