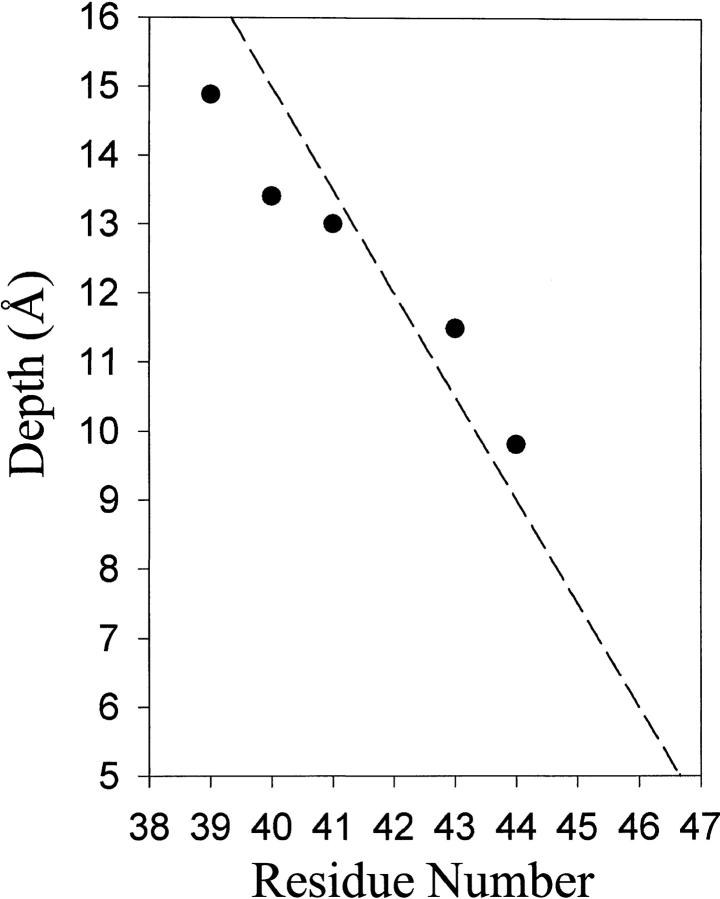
Fig. 5.
Immersion depths for solvent-exposed positions in TM1 of chemoreceptor Trg. Values of depth from the phosphate groups of the lipid bilayer were calculated as described (Gross et al. 1999). The dotted line has a slope of 1.5 Å/residue. The hydrophobic/hydrophilic boundary of the bilayer is at ∼5 Å.

