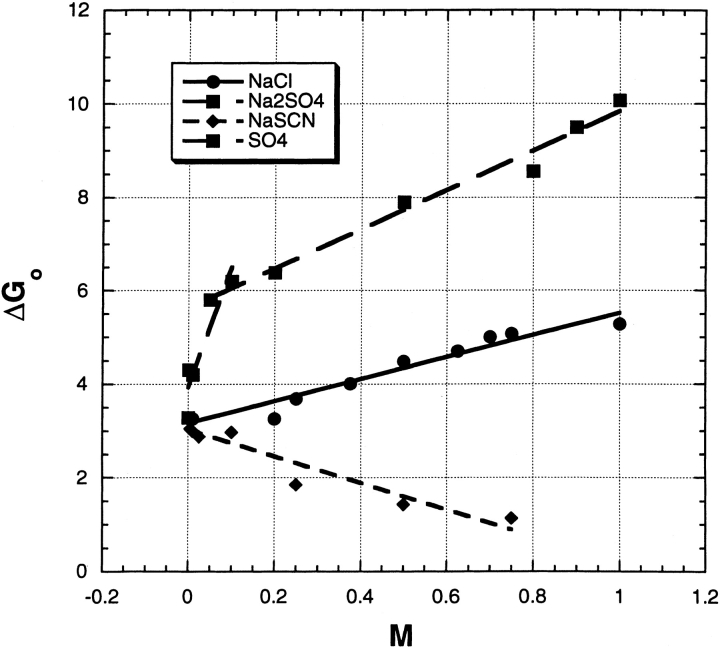
Fig. 1.
The free energy of urea-induced unfolding of RNase A in kcal/mol, extrapolated to zero urea concentration and plotted against salt molarity. Conditions: pH 3.0, 25°C, 3 mM glycine-HCl. The data are fitted with straight lines, and the sulfate data are fitted to a biphasic curve (hence two SO4 legends).

