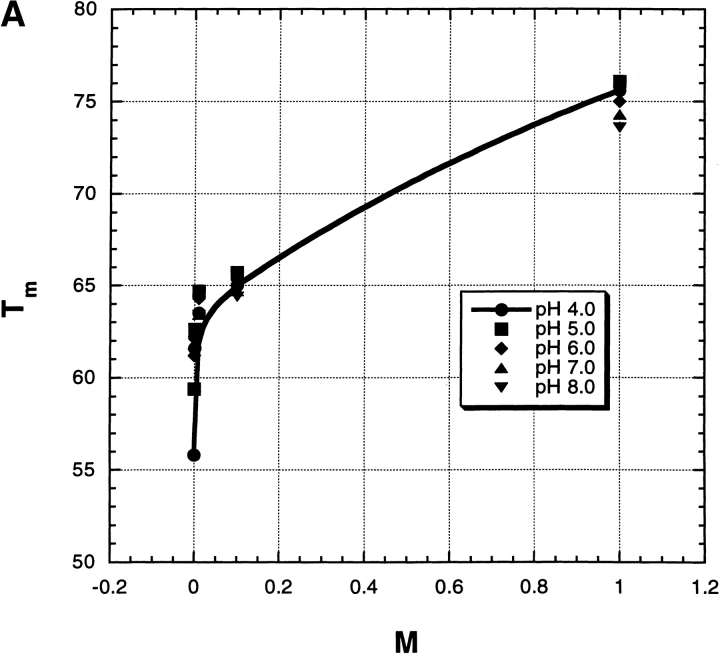
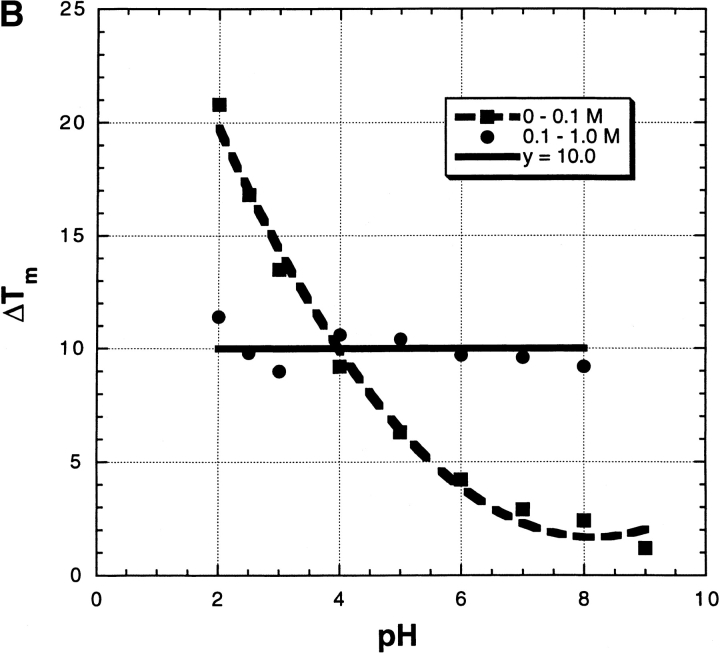
Fig. 5.
(A) The Tm values from Figure 4 ▶ plotted against Na2SO4 molarity at a series of pH values, to illustrate the biphasic nature of these curves. (B) From the experiments shown in Figure 4 ▶, the changes in Tm between 0 and 0.1 M Na2SO4, and also between 0.1 and 1.0 M, are plotted against pH. The horizontal line (y = 10.0) represents the average value of the change in Tm between 0.1 and 1.0 M.


