Fig. 5.
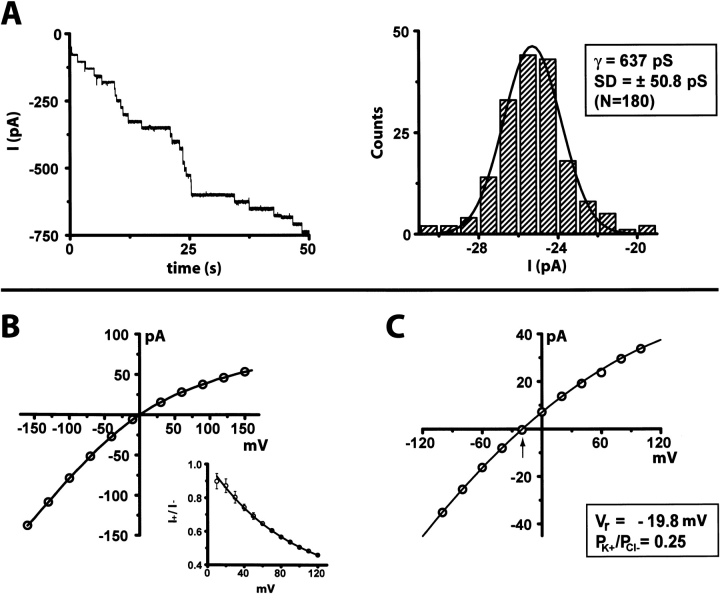
Single-channel recordings from HlyII pores. (A) Individual insertions of HlyII pores into planar lipid bilayers. HlyII oligomer was prepared by IVTT in the presence of rRBCM, purified by SDS-polyacrylamide gel electrophoresis, and added to the cis chamber of a bilayer apparatus. Both chambers contained 1 M KCl, 5 mM HEPES, pH 7.4, and the applied potential was −40 mV. Stepwise changes in current are shown as a function of time. A histogram of the current steps is displayed and represents a compilation from 15 independent recordings. The histogram was fitted to a Gaussian function to obtain the single-channel conductance. (B) Single-channel current–voltage (I-V) relationship. A representative plot is shown. (Inset) Plot of I+/I− versus voltage representing data (± SD) from four independent recordings. The conditions were as described in (A). (C) HlyII is anion selective at neutral pH. The reversal potential (Vr), the applied voltage that gave zero current (arrow), was determined from single channel I-V plots with asymmetrical KCl solutions (1000 mM KCl cis, 200 mM KCl trans, both in 5 mM HEPES, pH 7.4). A representative plot is shown. The permeability ratio (PK+/PCl−) was derived from the GHK equation.

