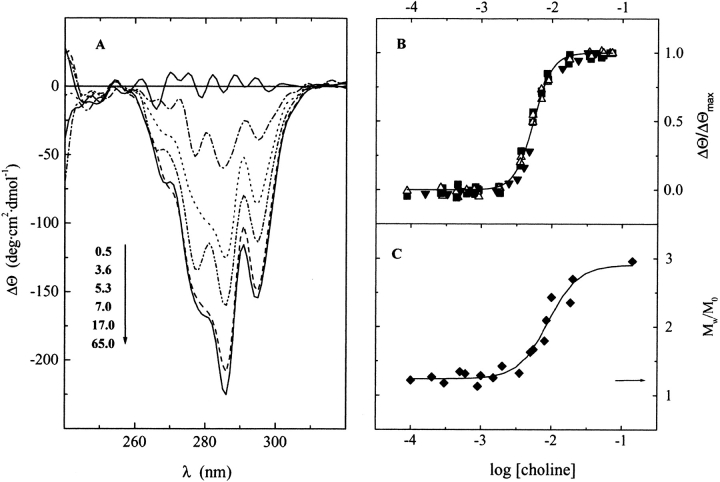
Fig. 1.
Choline titration curves of Ejl amidase. (A) CD differential spectra in the near region of the UV-spectra at increasing concentrations of choline in 20 mM phosphate buffer (pH 8.0, 25°C). The ligand concentrations, in mM units, are indicated in the figure labels. (B) Relative variations in the ellipticity at 286 (filled squares), 295 (open triangles), and 224 (filled triangles) nm; the solid trace is the best-fitting curve calculated for the Hill equation, using a Kapp of 1.8 × 10² M−1 and a Hill coefficient of 3. (C) Dependence of the apparent weight-average molecular mass of Ejl (5.5 μM) on choline concentration. The arrow indicates the Mw/M0 ratio of unbound Ejl (M0 is the monomer molecular weight).

