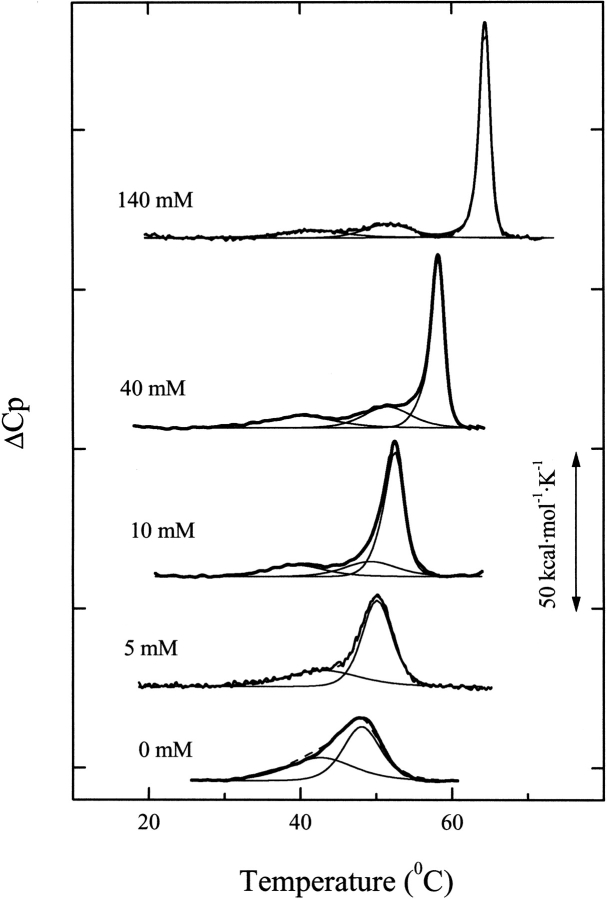
Fig. 5.
Effect of choline concentration on the DSC transitions of Ejl amidase. Calorimetric profiles of the Ejl amidase (27.4 μM) at the choline concentrations indicated in the curve labels (20 mM phosphate buffer, pH 8.0). Bold traces represent the experimental curves, the thin traces depict the results of deconvolution analysis, and the dashed line is the fitted profile. ΔCp values are in kcal•(mole of monomer)−1•K−1.

