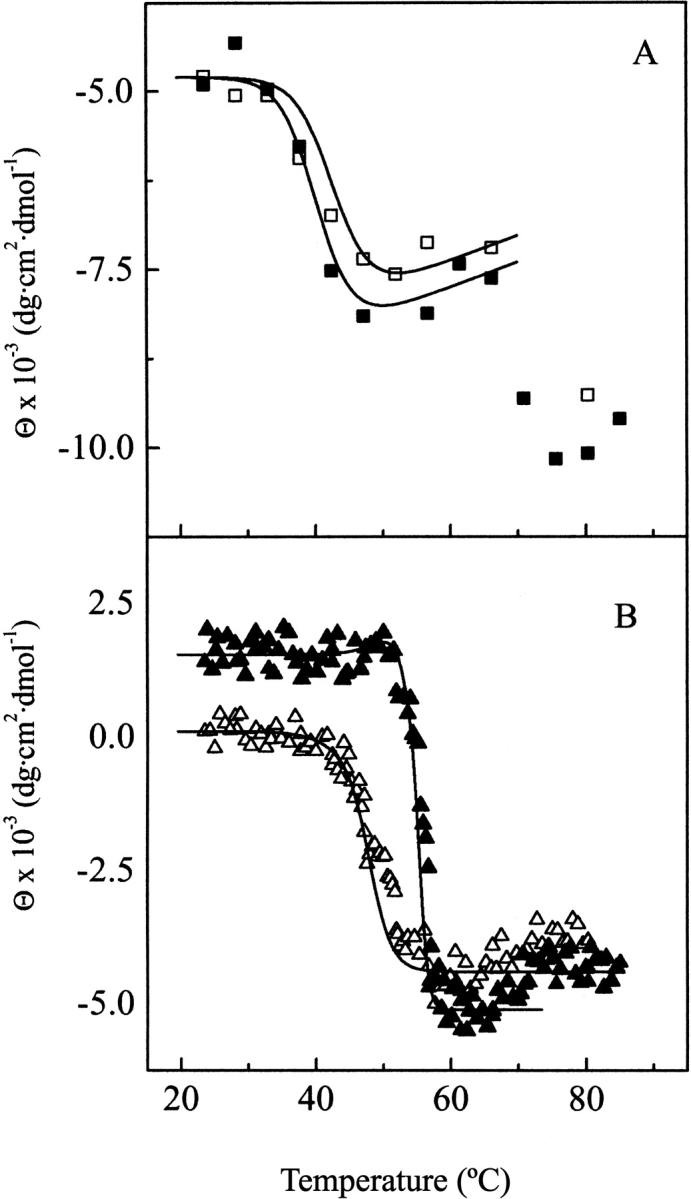
Fig. 6.

Temperature CD titration curves of Ejl. (A) and (B) depict the elliptiticity changes at 203 (squares) and 224 nm (triangles) as a function of temperature both in the absence (open symbols) and in the presence of 20 mM choline (full symbols), (5.5 μM Ejl; 20 mM phosphate buffer pH 8.0). Solid lines are the theoretical curves calculated according to equation 1 with the parameters reported in Table 4.
