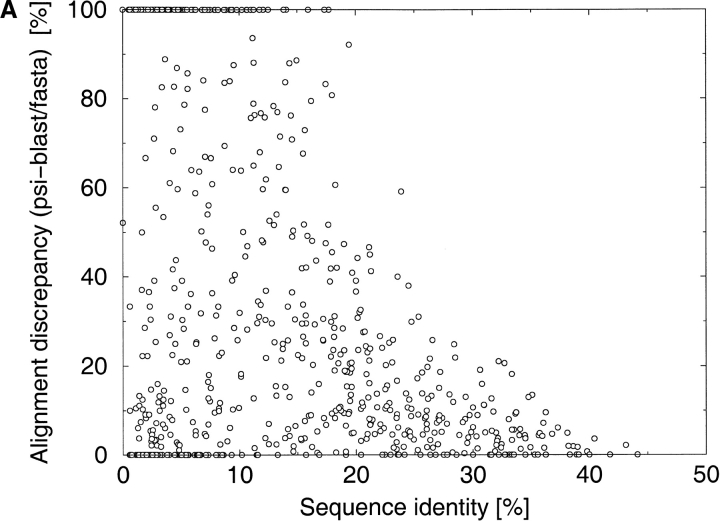
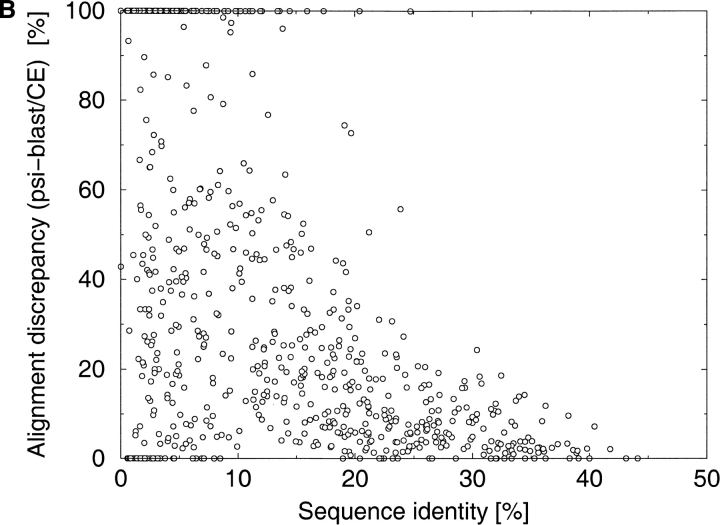
Fig. 2.
The distribution of discrepancies between the different alignments as a function of sequence identity. Alignment discrepancy is measured as the percentage of differently aligned residues in the shorter of two alignments. The discrepancies have been calculated for a comprehensive benchmark of protein pairs consisting of 742 protein pairs selected from the Structural Classification of Proteins (SCOP) database. (A) PSI-BLAST (Altschul et al. 1997) alignments versus FASTA (Pearson and Lipman 1988) alignments. (B) PSI-BLAST alignments versus CE (Shindyalov and Bourne 1998) structural alignments.


