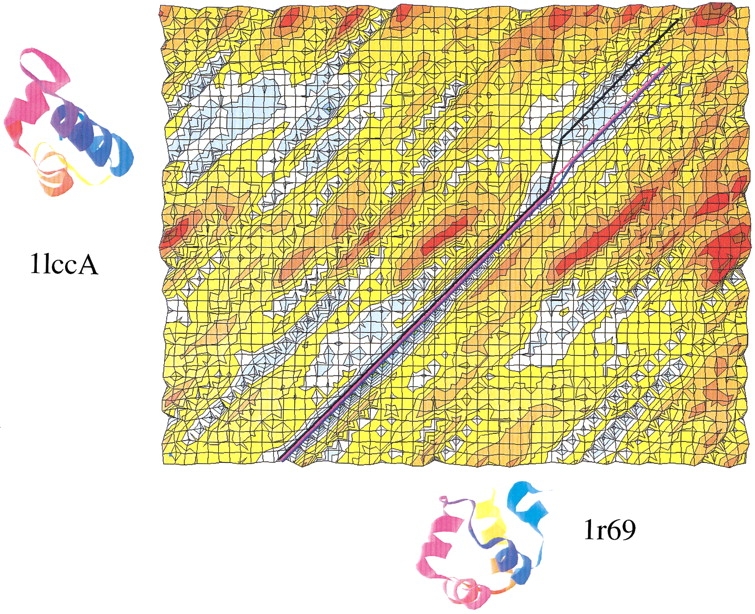
Fig. 3.

Fold and Function Assignment System (FFAS) similarity matrix (Rychlewski et al. 2000) calculated for 1r69 and 1lccA sequences and presented as a surface plot (blue colors mean higher similarity; red colors mean lower similarity). (A similarity matrix is a matrix describing a similarity score assigned to each pair of potentially aligned residues. Here, the X-axis corresponds to the query sequence and the Y-axis corresponds to the target sequence.) The picture illustrates an obvious discrepancy between the C-terminal fragments of the best-scoring Fold and Function Assignment System (FFAS) alignment (shown as a black path on the A1 matrix surface) and the CE structural alignment (shown in blue). The best suboptimal alignment (shown in pink) overlaps with 90% of the structural alignment. Root mean square deviation values of the FFAS alignment, the best suboptimal alignment, and the structural alignment are 3.6, 2.6, and 2.1 Å, respectively. All three alignments correctly assign the second and third helix of 1r69 to the first and second from 1lccA, but the lowest-scoring FFAS alignment incorrectly embraces the C-terminal part of the last helix from 1lccA. 1lccA is the N-terminal domain of the Lac repressor (LacR) from Escherichia coli. 1r69 is the DNA-binding domain of the C1 repressor from E. coli-derived Phage 434. Both proteins belong to the same structural superfamily in the SCOP database.
