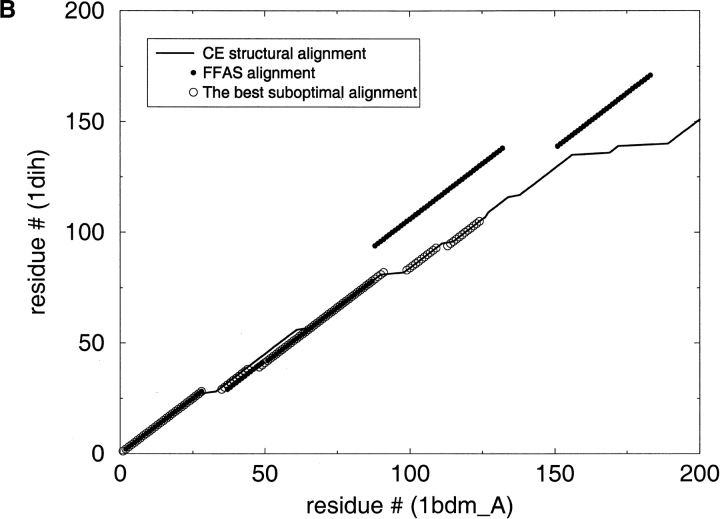
Fig. 5.
Applying the suboptimal alignment calculations. This graph illustrates the discrepancies between the original FFAS alignments and the CE structural alignments. The best suboptimal alignment is also shown in the graph. (A) 1bbt is foot-and-mouth disease virus protein; 1smv is sesbania mosaic virus coat protein. (B) 1bdm is malate dehydrogenase; 1dih is dihydrodipicolinate reductase.


