
Fig. 2.

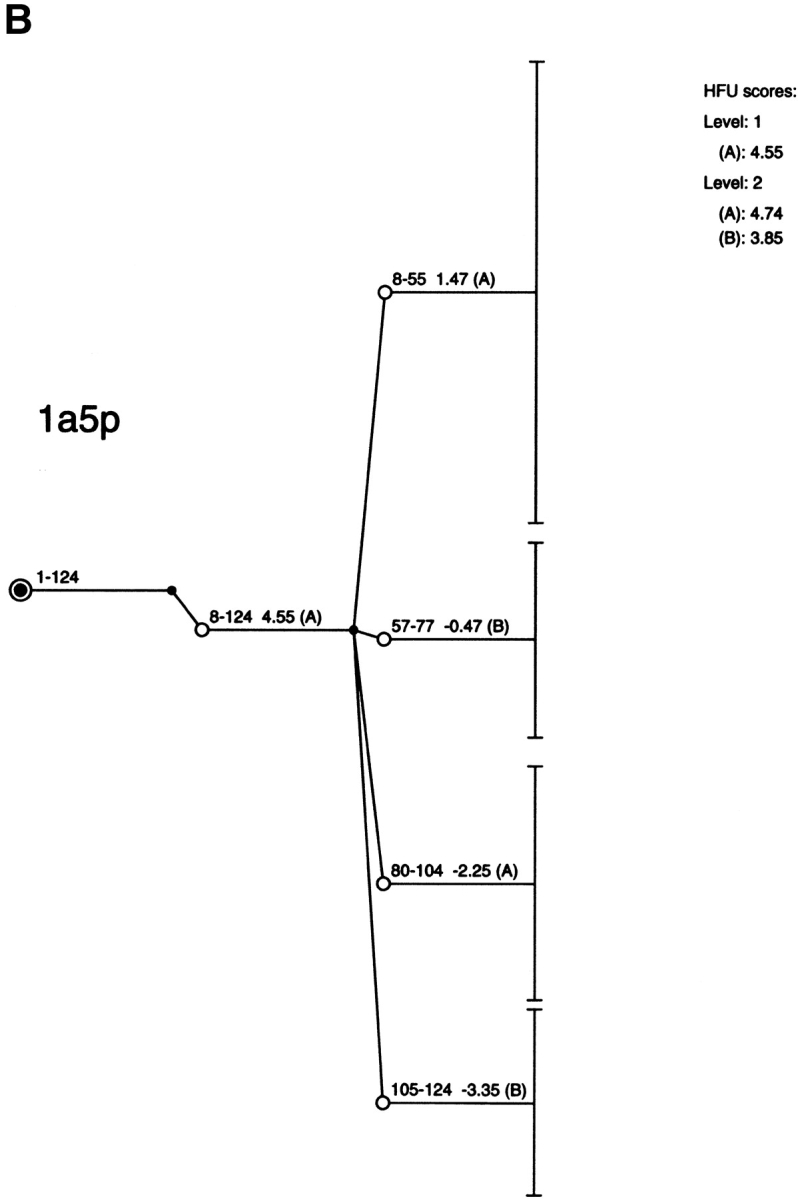

The results of the computational cutting of horse heart myoglobin (PDB 1wla). (A) The fragment map, where the x-axis is the location and the y-axis the size. All local minima are depicted in blue, and the building blocks taking part in the major folding pathway are in red. (B) The anatomy tree illustrating the major folding pathway. Each node corresponds to a fragment. The start and end positions of the building blocks are noted. These building blocks correspond to those drawn in red in part A. The stability of the building block is given next to the sequence position. The letters in parentheses denote the hydrophobic folding unit to which the algorithm assigns the building block. (C) A pictorial representation of the fold, building blocks, and hydrophobic folding units. The top row gives the iterative cuttings. Each building block is drawn in a different color. The bottom row depicts the results of the combinatorial assembly of the building blocks into hydrophobic folding units. All building blocks are specified in Table 1. To compare with the experimental dissection: Fontana et al. (1997) cut it in the 89–96 region (major cuts) and around position 30 (minor cut). These are the cumulative results by several proteolytic enzymes. NMR data indicate flexibility/unfolding of the 82–102 region (Eliezer and Wright 1996) and around 30 (Lecomte et al. 1996). The building blocks are specified in Table 1.