
Fig. 2.
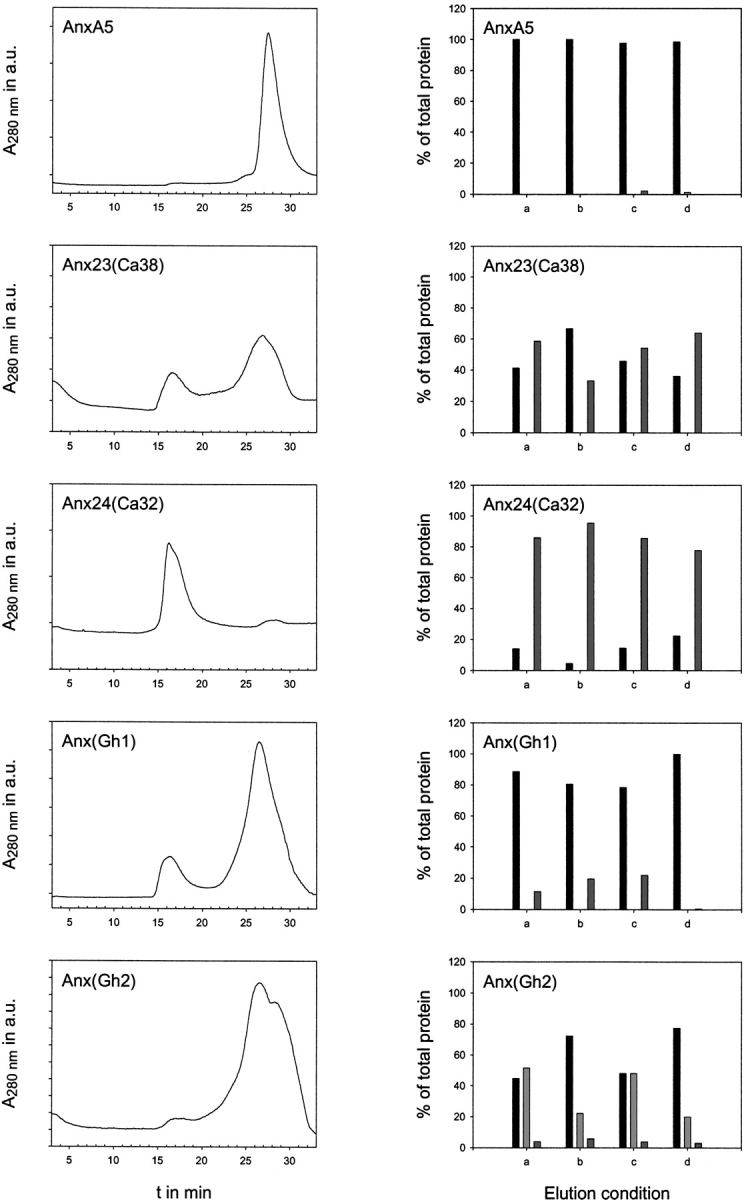
Gel filtration results. The left panel depicts representative gel filtration runs on a Superose-12 column with the five annexins under low salt conditions. Shown on the right panel are the oligomer distributions for the different proteins. The elution conditions are as follows: (a) low salt, (b) high salt, (c) low salt with 0.2% Tween20, and (d) low salt with 10 mM CaCl2. The monomer content is shown as black bar, the dimer as light gray, and the trimer contents as strong gray bars, respectively.