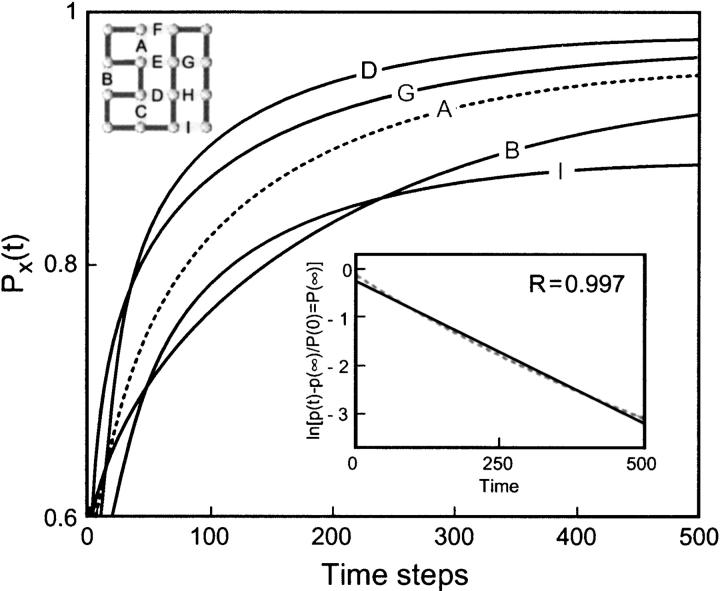
Fig. 1.
Time evolution of native contacts for the 16-mer. The time-dependent probability PX(t) of contacts X = A–D, G, I is shown. The inset shows the plot of ln{[PN(t) − PN(∞)]/[PN(0) − PN(∞)]} versus time where PN(t) is the probability of native state. The close fit (correlation coefficient = 0.997) to a line shows that the observed kinetics is single exponential.

