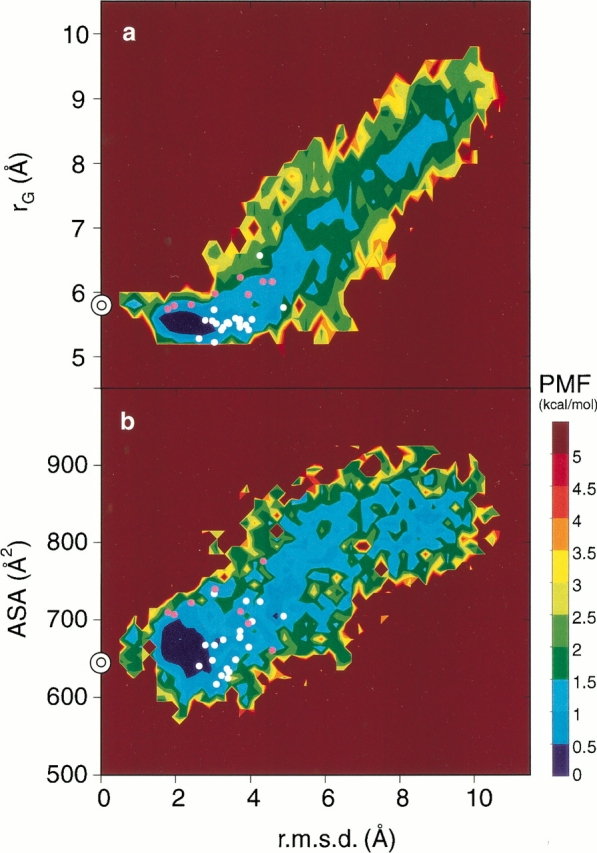
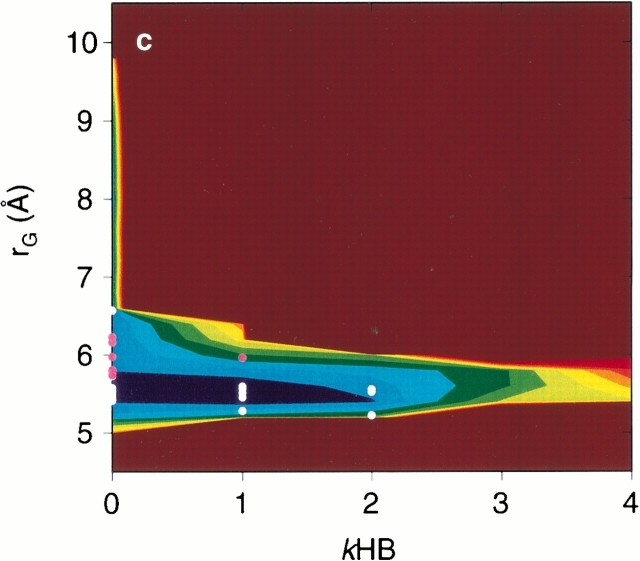
Fig. 5.

Free energy landscapes at 300 K drawn by the conventional arbitrary axes. (a) The radius of gyration rG and the r.m.s.d. from the ordered conformation, (b) the hydrophobic ASA and the r.m.s.d., and (c) rG and the numbers of kHB were used. The contour value in kcal/mol is shown on the right side of the figure. The double circles on the axis at r.m.s.d. = 0 are the positions for the ordered conformation. White and pink dots are the transition state conformations at A ― E and at B ― E in Fig. 1b ▶, respectively.

