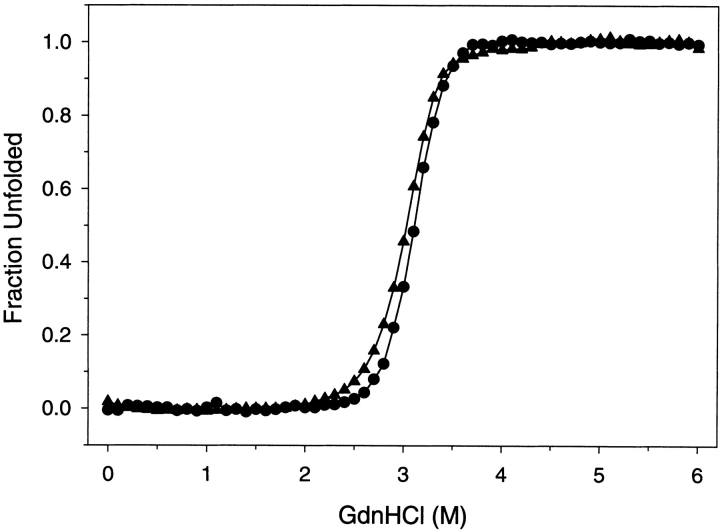
Fig. 2.
Equilibrium denaturation of G-CSF. Samples of G-CSF were equilibrated with varying concentrations of GdnHCl, and the fraction unfolded was determined by fluorescence (filled triangles) and by circular dichroism (filled circles). The G-CSF concentration was 25 μg/mL, pH 4, and the temperature was 20°C.

