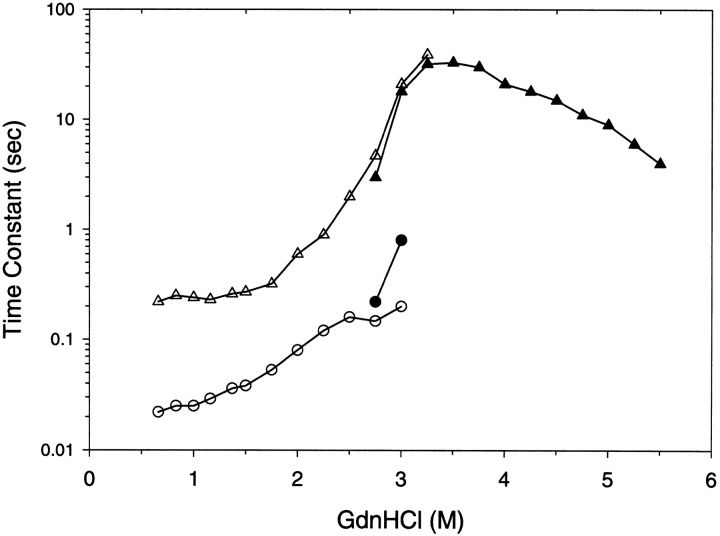
Fig. 3.
Kinetic time constant results for G-CSF as determined by fluorescence. Refolding experiments are illustrated by the open symbols (circles, triangles) and unfolding experiments by the filled symbols (circles, triangles). The final concentrations of GdnHCl after unfolding and refolding are shown in the abscissa. Two kinetic time constants were observed; the triangles represent the slower time constant, and the circles represent the faster time constant. The kinetic results were obtained at 10°C in 20 mM acetate pH 4.0, and 0.1 mg/mL.

