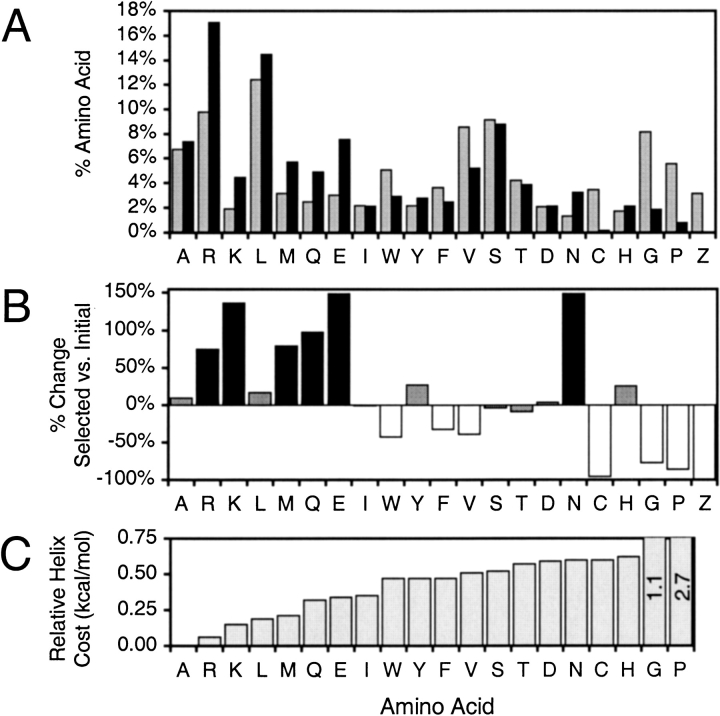
Fig. 1.
Overall amino acid representation in selected randomized regions. (A) The composition in selected sequences (black) compared to the composition in the initial random library (gray). Z represents a stop codon. (B) Percent changes in amino acid representations from the initial pool to the selected pool. Shadings represent amino acids that are >30% overrepresented (black) or underrepresented (white) in final sequences. (C) Amino acids ordered by their relative intrinsic energetic costs of adopting helical dihedral angles (Munoz and Serrano 1995).

