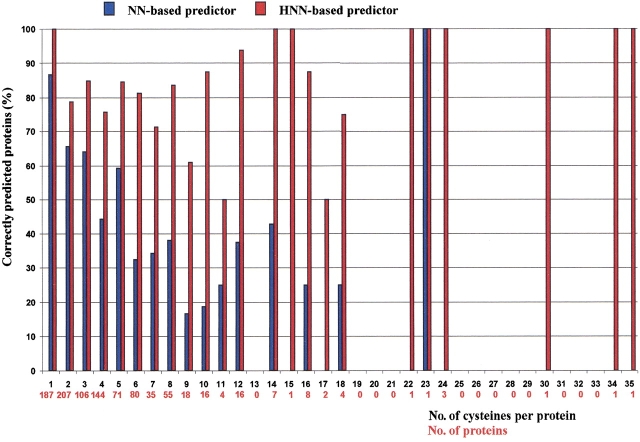
Fig. 2.
Bar plots of the predictions. The percentage of proteins correctly predicted (one chain is accepted only if the bonding and nonbonding states of all the cysteines in the chain are correctly predicted) is shown as a function of the number of cysteines in the chain. Furthermore, the number of proteins with a given number of cysteines in the chain is also shown along the X-axis. Red and blue bars indicate the predictions of the hybrid system and of the neural network, respectively.

