
Fig. 2.
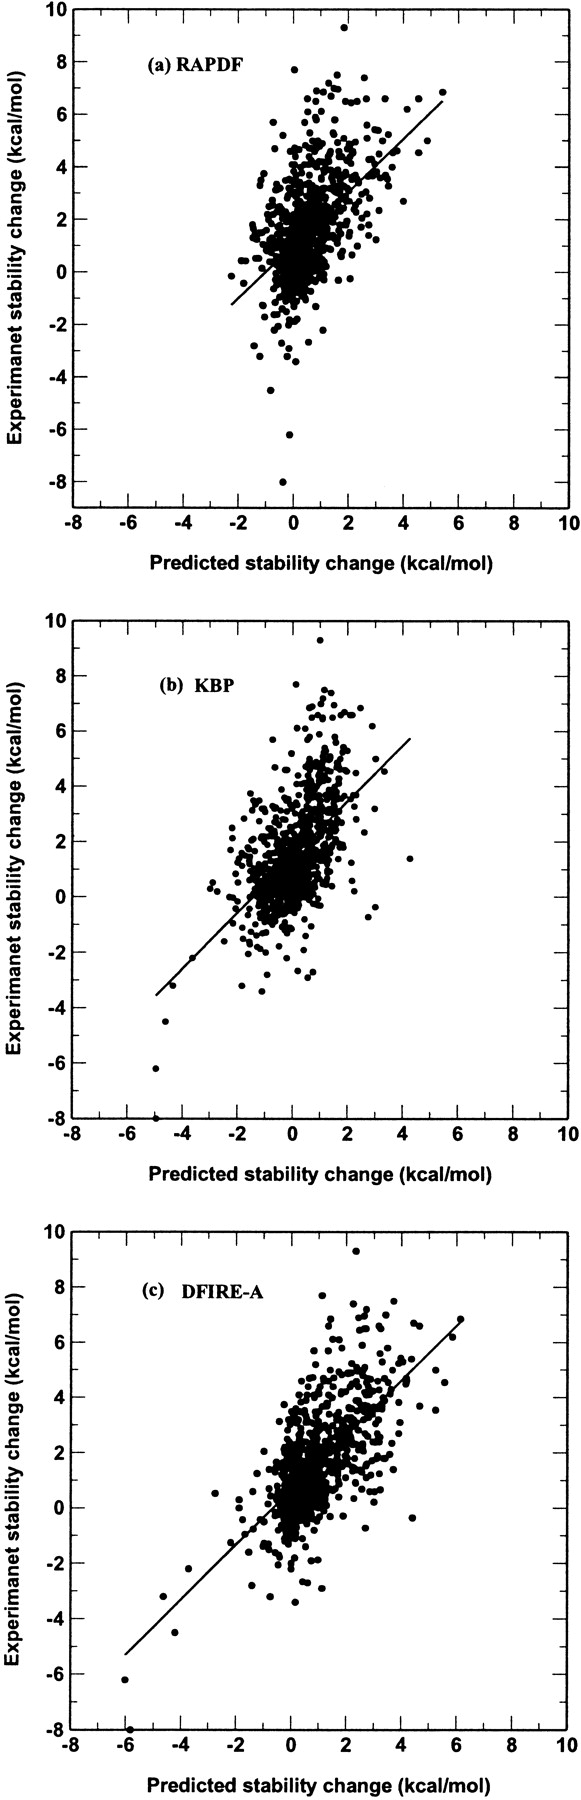
The experimentally measured changes in stability versus theoretically predicted ones in a database of 895 large-to-small mutations. (a) RAPDF, (b) atomic KBP, (c) DFIRE-A. Lines represent the results from linear regression fit. The correlation coefficients are 0.52, 0.55, and 0.67 for RAPDF, atomic KBP and DFIRE-A, respectively.