
Fig. 2.
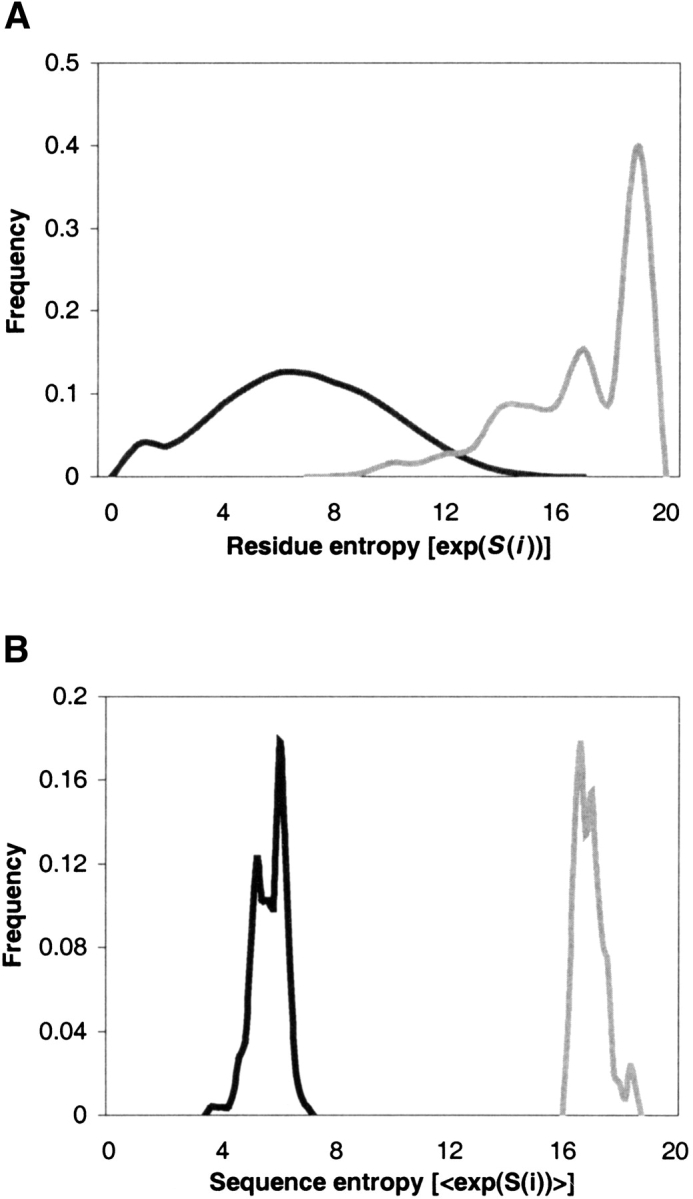
Entropy distributions of designed and sterically allowed residues and sequences. (A) Residue entropies of all designed positions are plotted in black. As well, the set of all sterically allowed rotamers at each position of each structure was calculated. The distribution of residue entropies for this set is plotted in gray. (B) The sequence entropy (mean residue entropy) for each structure was calculated. The distribution of sequence entropies for the designed sequences is plotted in black, with the sequence entropy from the allowed rotamers in gray.