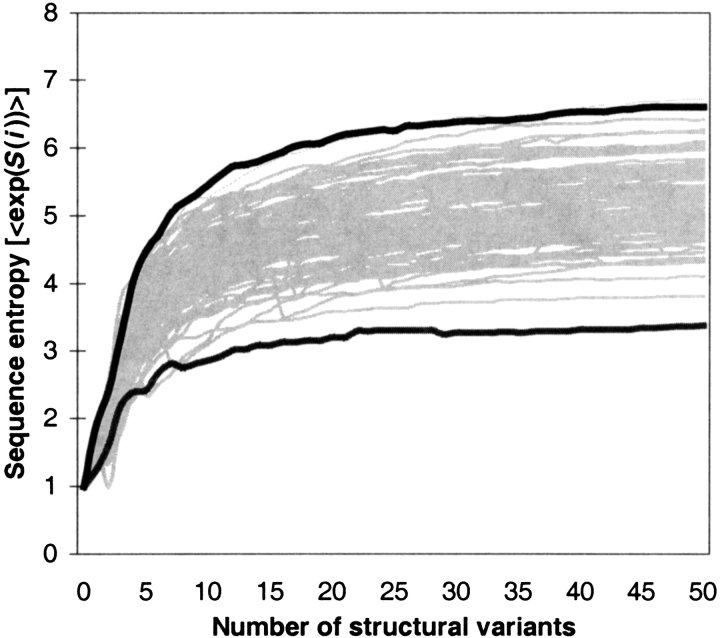
Fig. 4.
Sequence entropy increases with the size of the structural ensemble used for design. The traces represent the sequence entropy of the designed sequences obtained when using increasing numbers of structural variants as targets for design. The black traces represent the two structures that produced sequence sets with the highest and lowest average sequence entropy. The gray traces are for 100 different structures randomly picked from the remaining 251 proteins.

